What's new

General About FXOpen – FXOpen.com

4.40 star(s) 7 Votes
EUR/USD Eyes Recovery, USD/CHF Remains Elevated


EUR/USD declined heavily below 1.2000 and it tested 1.1850. USD/CHF is rising and it could rally further if it clears the 0.9200 and 0.9220 resistance levels.

Important Takeaways for EUR/USD and USD/CHF


  • The Euro started a fresh decline from well above the 1.2000 zone against the US Dollar.
  • There was a break above a connecting bearish trend line with resistance near 1.1900 on the hourly chart of EUR/USD.
  • USD/CHF gained bullish momentum above the 0.9050 and 0.9120 resistance levels.
  • There is a key bearish trend line forming with resistance near 0.9200 on the hourly chart.

EUR/USD Technical Analysis

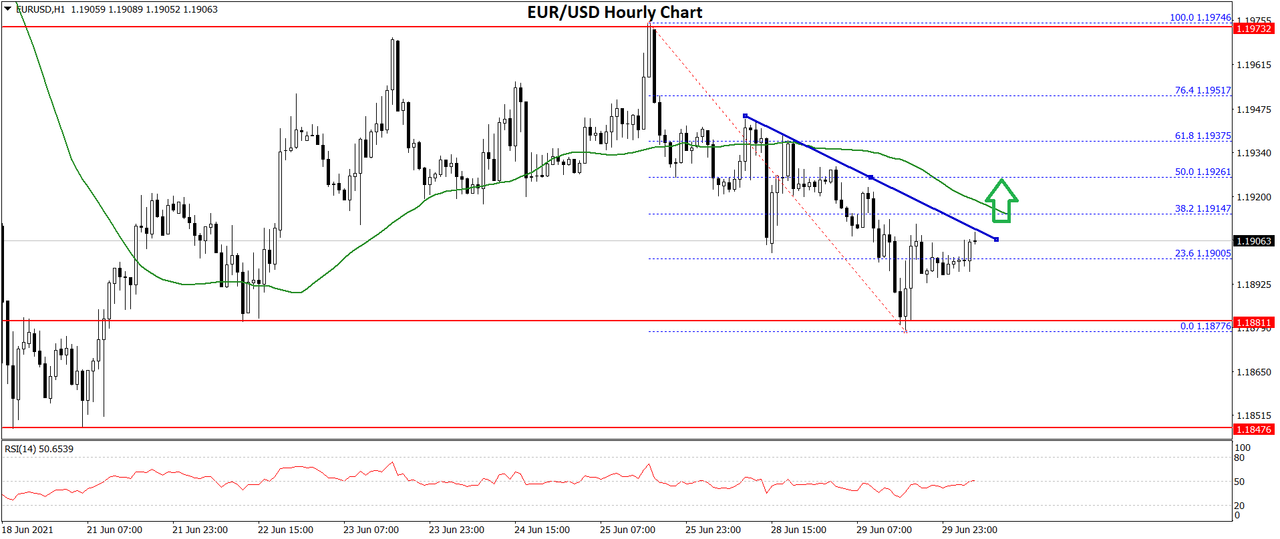
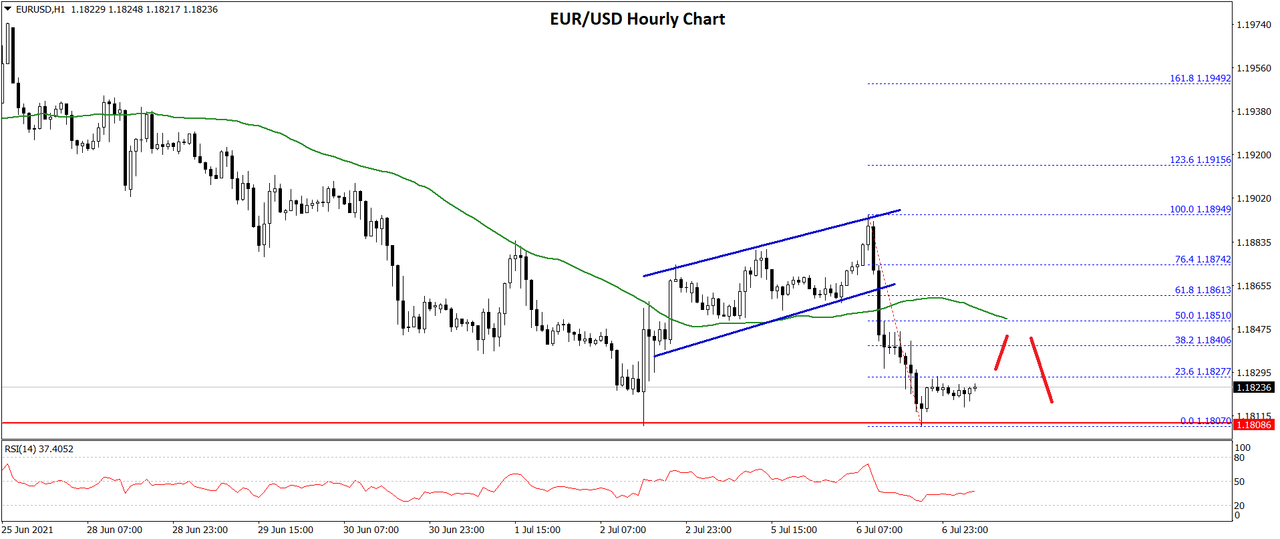
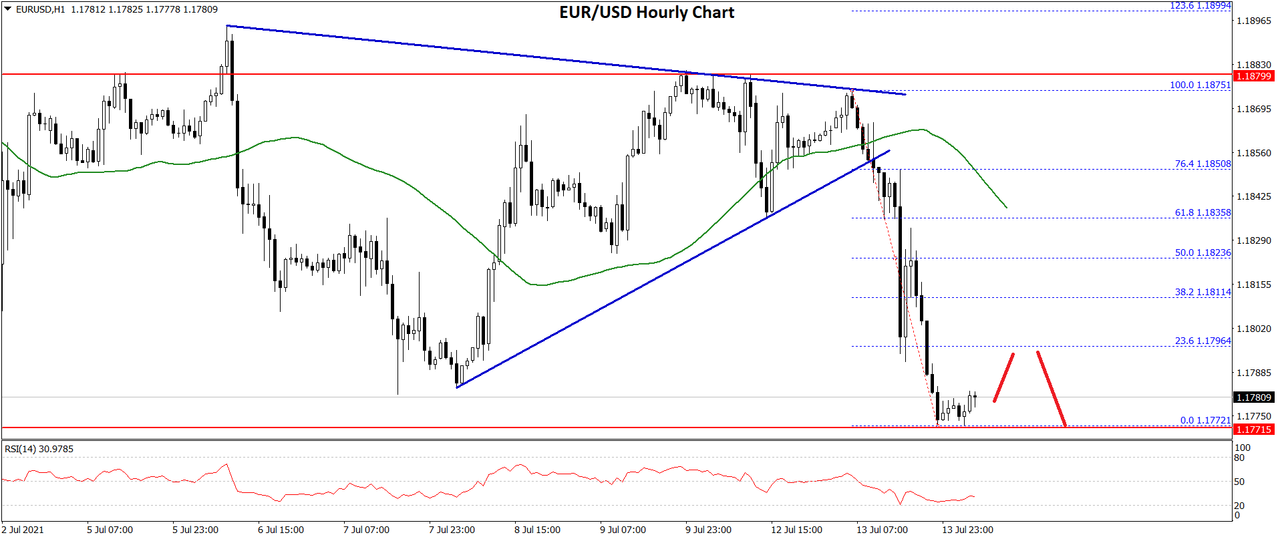
The Euro struggled to gain pace above the 1.2150 level and it started a major decline against the US Dollar. As a result, the EUR/USD pair broke the main 1.2000 support zone to move into a bearish zone.

The pair even declined below the 1.1920 support zone and settled below the 50 hourly simple moving average. A low was formed near 1.1846 on FXOpen and the pair is now correcting losses. It corrected above the 1.1880 and 1.1900 resistance levels.


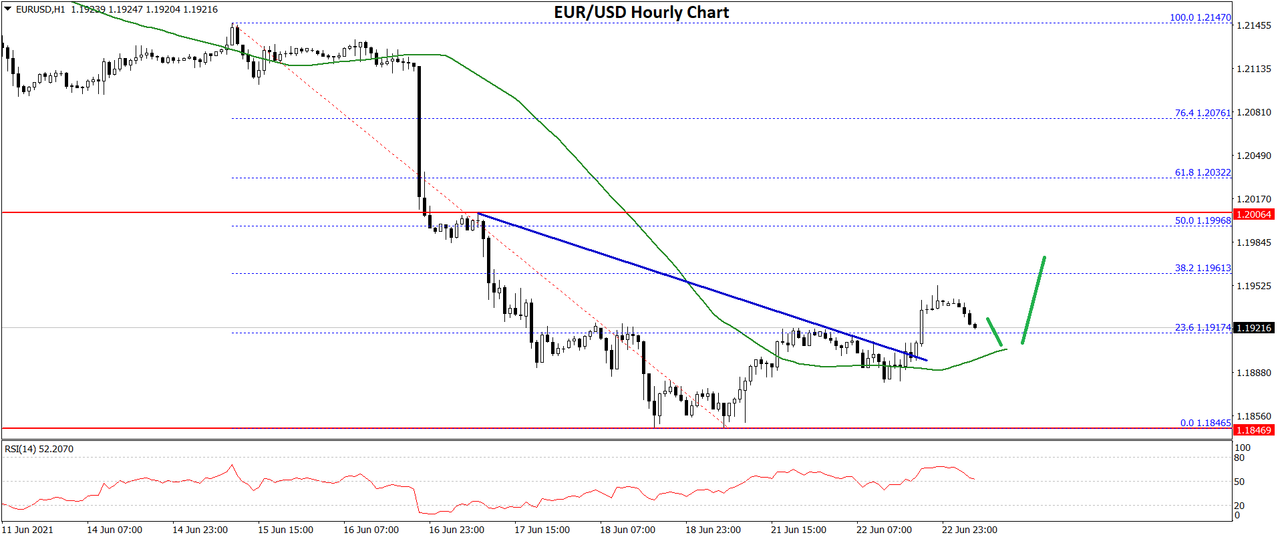
There was a break below the 23.6% Fib retracement level of the recent decline from the 1.2147 high to 1.1846 low. There was also a break above a connecting bearish trend line with resistance near 1.1900 on the hourly chart of EUR/USD.

It is now trading nicely above the 1.1900 support zone and the 50 hourly SMA. On the upside, the pair is facing hurdles near the 1.1940 and 1.1950 levels. A clear upside break above 1.1950 could set the pace for a larger recovery.

The next major resistance is near the 1.2000 zone. On the downside, there is a major support forming near the 1.1900 zone. The next key support is near the 1.1880 level. A downside break below the 1.1880 support could restart decline. The next major support could be near the 1.1820 level.


Read Full on FXOpen Company Blog...
 
LTC and EOS – The start of a another recovery seen most likely


LTC/USD

The price of Litecoin has been on the rise since Tuesday when it came down to $104.9 at its lowest point. From there we have seen an increase of 27% as it reached $133.3 at its highest point today. Currently, it is trading slightly lower but is still in an upward trajectory.


On the hourly chart, we can see that the price fell into a lower low compared to the May 23rd one and spiked to the upside, reaching the broken downtrend support which is being now tested for resistance. If the price finds resistance here another move to the downside would be expected, but only as a pullback before further upside continuation. This is so because on the 22nd we have most likely seen the end of the corrective five-wave move from the 27th of May so now a move to the upside like it developed from the 23rd till the 27th would be expected.

The price could now increase as much as 35% but it would be expected to go lower than on the 27th when it came up to $209. This is because the price made a lower low which is why a lower high would be more likely. Another possibility could be that we have seen the start of a completely new impulse wave to the upside and that the 22nd of June’s low was the completion of the higher degree down move. But this is going to be validated from the type of descending move we see after this expected rise.


Read Full on FXOpen Company Blog...
 
AUD/USD and NZD/USD Eye More Upsides Above Resistance


AUD/USD started a decent recovery wave above 0.7550. NZD/USD is also rising and it could continue to rise if it clears the 0.7100 resistance zone.

Important Takeaways for AUD/USD and NZD/USD


  • The Aussie Dollar found support near 0.7475 after a steady decline against the US Dollar.
  • There is a key bullish trend line forming with support near 0.7560 on the hourly chart of AUD/USD.
  • NZD/USD also started a decent increase from the 0.6925 zone, and it climbed above 0.7000.
  • There is a major bullish trend line forming with support near 0.7050 on the hourly chart of NZD/USD.

AUD/USD Technical Analysis

After a major decline, the Aussie Dollar found support near the 0.7475 zone against the US Dollar. The AUD/USD pair started a steady recovery after it broke the 0.7500 resistance zone.

It broke the 0.7550 resistance zone and the 50 hourly simple moving average. The pair even broke the 38.2% Fib retracement level of the key decline from the 0.7715 high to 0.7476 low (formed on FXOpen).


An initial resistance on the upside is near the 0.7595. It is near the 50% Fib retracement level of the key decline from the 0.7715 high to 0.7476 low. A proper break above the 0.7595 and 0.7600 resistance levels could open the doors for a steady increase.

The next major resistance is near the 0.7660 level. Any more gains could lead the pair towards the 0.7700 level. Conversely, the pair could correct gains from 0.7600.

An initial support on the downside is near the 0.7560 level. There is also a key bullish trend line forming with support near 0.7560 on the hourly chart of AUD/USD. The next major support is near the 0.7550 level. If there is a downside break below the trend line support, the pair could extend its decline towards the 0.7500 level.


Read Full on FXOpen Company Blog...
 
GBP/USD and EUR/GBP: British Pound Could Continue To Struggle


GBP/USD failed to clear the key 1.4000 resistance zone and corrected lower. EUR/GBP is rising and it might gain pace if it clears the 0.8600 barrier.

Important Takeaways for GBP/USD and EUR/GBP


  • The British Pound failed to gain pace above the main 1.4000 resistance zone.
  • There is a major bearish trend line forming with resistance near 1.3920 on the hourly chart of GBP/USD.
  • EUR/GBP started a fresh increase after it found a strong support near the 0.8530 zone.
  • There is a short-term contracting triangle forming with resistance near 0.8595 on the hourly chart.

GBP/USD Technical Analysis

The British Pound failed to reclaim the 1.4000 handle and it started a fresh decline against the US Dollar. The GBP/USD pair broke the 1.3900 support zone and the 50 hourly simple moving average.

The pair even spiked below 1.3800 before it found support near 1.3785. A low was formed near 1.3786 and the pair recently started an upside correction. There was a break above the 1.3850 and 1.3900 resistance levels.


The pair even moved above 1.3950, but it failed to clear the 1.4000 resistance zone. A high was formed near 1.4000 and the pair is now moving lower.

It broke the 50% Fib retracement level of the upward move from the 1.3786 swing low to 1.4000 high. It is now trading below 1.3900 and the 50 hourly simple moving average. There is also a major bearish trend line forming with resistance near 1.3920 on the hourly chart of GBP/USD.

An immediate support on the downside is near the 1.3865 level. It is near the 61.8% Fib retracement level of the upward move from the 1.3786 swing low to 1.4000 high.

A downside break below the 1.3865 level might call for a fresh decline towards the 1.3800 level. On the upside, an immediate resistance is near the 1.3920 level. The next major resistance is near the 1.4000 level.

A successful close above 1.3920 and a follow up move above 1.4000 could open the doors for a move towards the 1.4120 resistance.


Read Full on FXOpen Company Blog...
 
Financial Markets Turn Their Attention to Jobs Data


Financial markets reversed their initial reaction after the latest FOMC Statement and press conference. In the two days that followed the June Fed meeting, the US dollar gained ground significantly against its peers in the developed world.

As such, the EURUSD fell from above 1.22 to 1.1850, the AUDUSD dropped a couple of hundred of pips, while the GBPUSD was strongly rejected at the 1.42. Also, stocks dropped in the United States and triggered a sharp decline in other equity markets too.

But it all lasted only two days. The week that just ended has seen the market participants changing their minds. Stocks reversed sharply, the US dollar weakness resumed, and overall risk-on outperformed.

What changed in the meantime? The answer comes from the Fed. Last Tuesday, Fed’s Chair Jerome Powell testified in front of the House Select Subcommittee on the Coronavirus Crisis, and he downplayed the hawkish statement. Moreover, Fed members held speeches the entire week, reassuring markets that the accommodative measures will remain in place for quite some time despite the hawkish dot plot.

Furthermore, the Fed still sees inflation as transitory. Food and energy prices are expected to come down past 2021, even though right now inflation exceeds the Fed’s target.


Focus Turns to Job Creation

Now that the inflation has reached the Fed’s target, the only chance the US dollar bulls have is for the job market to show significant improvements. While the strong economic growth and improvements in the labor market should bode well for the currency and the stock market indices, further developments in the labor market will bring the Fed closer to its job creation mandate.

Therefore, the Fed’s hawkish message will have greater credibility if the US economy is able to create more jobs. We will find out as soon as next week the current state of the labor market as the Non-Farm Payrolls report for the month of May is due.


FXOpen Blog
 
EUR/USD Eyes Fresh Increase, USD/JPY Could Extend Losses


EUR/USD is likely to start a steady increase if it clears the 1.1920 resistance zone. USD/JPY could extend its decline below the 110.40 support zone in the near term.

Important Takeaways for EUR/USD and USD/JPY


  • The Euro is consolidating losses above the 1.1880 support zone.
  • There is a key bearish trend line forming with resistance near 1.1915 on the hourly chart of EUR/USD.
  • USD/JPY declined below the 110.00 and 110.60 support levels.
  • There is a major declining channel forming with resistance near 110.85 on the hourly chart.

EUR/USD Technical Analysis


After a close below 1.2000, the Euro saw bearish moves against the US Dollar. The EUR/USD pair even tested the 1.1850 support zone before starting a decent upward move.

The pair climbed above the 1.1900 resistance zone. It even broke 1.1950 and the 50 hourly simple moving average. However, the pair failed to clear the 1.2000 zone. A high was formed near 1.1974 on FXOpen and the pair corrected gains.

It tested the 1.1880 zone and it is now rising. There was a break above the 23.6% Fib retracement level of the recent decline from the 1.1974 high to 1.1877 low.

It is now facing resistance near the 1.1915 zone and the 50 hourly simple moving average. There is also a key bearish trend line forming with resistance near 1.1915 on the hourly chart of EUR/USD. The next key resistance is near the 1.1925 level.

The 50% Fib retracement level of the recent decline from the 1.1974 high to 1.1877 low is also near 1.1925. A close above 1.1915 and 1.1925 could open the doors for a steady increase.

An intermediate support is near the 1.1880 level. The next major support is near the 1.1850 level, below which the pair could drop towards the 1.1800 support.


Read Full on FXOpen Company Blog...
 
Gold Price and Crude Oil Price Aim Higher


Gold price started a decent recovery wave from the $1,750 support. Crude oil price is rising and it is now trading nicely above the $74.00 level.

Important Takeaways for Gold and Oil


  • Gold price started a fresh recovery wave after forming a base above $1,750 against the US Dollar.
  • There is a key bearish trend line forming with resistance near $1,780 on the hourly chart of gold.
  • Crude oil price climbed higher and it even surged above the $75.00 resistance.
  • There was a break above a major contracting triangle with resistance near $73.65 on the hourly chart of XTI/USD.

Gold Price Technical Analysis


This week, gold price formed a decent support base above the $1,750 zone against the US Dollar. The price started a fresh upward move and it surpassed the $1,760 resistance zone.

The price even settled above the $1,765 level and the 50 hourly simple moving average. However, the price seems to be facing a strong resistance near the $1,780 zone. There is also a key bearish trend line forming with resistance near $1,780 on the hourly chart of gold.

A high is formed near $1,782 on FXOpen and the price is now consolidating gains. An upside break above the trend line could spark more gains above $1,782.

An immediate resistance on the upside is near the $1,795 level. The first major resistance is near the $1,800 level. If the price breaks the $1,800 level, it could accelerate higher. In the stated case, the price could rise towards the $1,840 zone.

Conversely, the price might resume its decline below $1,775. An initial support is near the $1,765 level. It is near the 50% Fib retracement level of the recent increase from the $1,750 low to $,1782 high.

The first major support is near the $1,760 level. The next key support is near the $1,750 level, below which the price might continue to move down towards the $1,720 level in the near term.

Read Full on FXOpen Company Blog...
 
GBP/USD and GBP/JPY: British Pound Eyes Strong Recovery


GBP/USD is slowly recovering, but it must break 1.3850 for more upsides. Similarly, GBP/JPY could gain pace if it clears the 1.3850 resistance zone in the near term.

Important Takeaways for GBP/USD and GBP/JPY


  • The British Pound is attempting a decent recovery wave above the 1.3800 zone against the US Dollar.
  • There is a key bearish trend line forming with resistance near 1.3835 on the hourly chart of GBP/USD.
  • GBP/JPY seems to be forming a base above the 153.00 support zone.
  • There was a break above a major bearish trend line with resistance near 153.40 on the hourly chart.

GBP/USD Technical Analysis


In the past few sessions, the British Pound saw bearish moves below the 1.4000 zone against the US Dollar. The GBP/USD pair traded below many supports near 1.3900 and 1.3850 to move into a bearish zone.

The pair even traded below the 1.3800 level and the 50 hourly simple moving average. A low is formed near 1.3731 on FXOpen and the pair is currently correcting losses. There was a break above the 1.3780 resistance zone.

The pair recovered above the 23.6% Fib retracement level of the key decline from the 1.3999 high to 1.3731 low. The pair is now trading above the 1.3800 zone and the 50 hourly simple moving average.

On the upside, an initial resistance on the is near the 1.3835 level. There is also a key bearish trend line forming with resistance near 1.3835 on the hourly chart of GBP/USD. The next major resistance is near the 1.3850 level.

The main resistance is near 1.3865 level. It is close to the 50% Fib retracement level of the key decline from the 1.3999 high to 1.3731 low. The next key resistance is near the 1.3900 level, above which the pair could rise towards the main 1.4000 resistance.

On the downside, an initial support is near the 1.3800 level and the 50 hourly SMA. If there is a break below the 1.3800 support, the pair could test the 1.3750 support. If there are additional losses, the pair could decline towards the 1.3640 level.

Read Full on FXOpen Company Blog...
 
Crude Oil Price Diverges from US Dollar Strength


One of the most interesting divergences in financial markets formed recently. The price of oil remains stubbornly elevated, closing the previous week above $75 per one barrel, despite ongoing dollar strength.

Since April 2020, the price of oil has come a long way. It dipped below the zero level for the first time ever, as the futures market settled close to -$40 twelve months ago. But from that moment on, it ripped higher, recovering all the pandemic losses and some more.

Because oil remains a big chunk of energy consumption in the United States and the rest of the world, higher oil prices fuel higher inflation. Higher inflation, on the other hand, pressures central banks to act and raise the interest rates, as most of them have a price stability mandate given by an inflation-targeting framework.


Commodities vs. Interest Rates

A classic correlation in financial markets tells us that commodities tend to underperform when interest rates are rising. It is not the case this time.

While the interest rates are not off their lows, the Federal Reserve of the United States started to talk hawkish. At its last meeting, the Fed signaled more rate hikes in the near future than the market expected, triggering a move higher in the US dollar.

As such, the EURUSD pair fell from above 1.22 to 1.18, the GBPUSD from 1.42 to 1.38, and the AUDUSD from 0.78 to below 0.75. But the strength in the US dollar did not bring a correction in the price of oil. Just the opposite.

A couple of things may help explain the divergence. On the one hand, the recent Iranian presidential elections have postponed the likelihood for Iranian oil to hit the market anytime soon. On the other hand, the OPEC+ recent meetings failed to commit new supplies for the second half of the year, despite the fact that demand is forecast to rise by 3 million barrels/day in the second half of the year.

Hence, the imbalances in supply and demand point to further upside in the price of oil, despite the Fed’s hawkishness. Many voices in the market suggest that the Fed will signal the tapering of its asset purchases at the upcoming Jackson Hole Symposium in August.

Therefore, until August, the US dollar’s strength will likely persist in expectations of the Fed’s message. Yet, as long as it remains above $70, the price of oil remains bid too, threatening with a move above $80 and beyond.


FXOpen Blog
 
Changes to CFD Trading on Independence Day


Dear Traders!

Please note that due to Independence Day celebrated in the USA on 4 July 2021 you may experience the following changes:

Monday, July 5th

Metals:
trading ends at 20:00 GMT+3;

Indices CFD:
  • Japan 225: trading ends at 20:00 GMT+3;
  • US SPX 500 (Mini): trading ends at 20:00 GMT+3;
  • US Tech 100 (Mini): trading ends at 20:00 GMT+3;
  • Wall Street 30 (Mini): trading ends at 20:00 GMT+3

Stocks CFD: trading closed.

All other financial instruments will be traded without changes.

FXOpen Company News
 
BTC and XRP – Breakout from the range will dictate the next trend


BTC/USD

The price of Bitcoin has been on the rise since the 26th of Jun and made it back to the $36,000 area on the 29th. From there we have seen a descending move with the price moving sideways after. Currently, it is being traded at $$33,893 and made a lower high today compared to yesterday’s one and is moving to the downside.


Looking at the hourly chart, you can see that a triangle is being formed which could be the 2nd sub-wave of the higher degree descending move. Considering that the prior move ended most likely as the ABC correction to the upside with the price falling back inside the territory of the lower range of the 1st wave from the 22nd. this is currently more likely. In this case, the price is to form the 3rd wave from the descending move that started on the 16th of Jun when another three-wave ABC to the upside completed.

If this is true, then we will see a breakout to the downside below the $31,000 mark, which served as a strong horizontal support level. However, this sideways movement that formed a triangle could be a consolidation range before another move to the upside that is set to break the $36,183 horizontal resistance. This is why the validation will come as a breakout direction from the mentioned triangle and will dictate the next dominant trend.


Read Full on FXOpen Company Blog...
 
EUR/USD and EUR/JPY: Euro Remains At Risk of More Downsides


EUR/USD started a fresh decline and it settled below 1.1900. EUR/JPY is showing bearish signs and upsides are likely to remain limited above 131.00.

Important Takeaways for EUR/USD and EUR/JPY


  • The Euro declined below the 1.1920 and 1.1900 support levels, and tested 1.1800.
  • There was a break below a short-term ascending channel with support near 1.1865 on the hourly chart.
  • EUR/JPY started a major decline after it failed to stay above the 131.50 support.
  • There is a key bearish trend line forming with resistance near 131.80 on the hourly chart.

EUR/USD Technical Analysis

The Euro started a fresh decline from the 1.2000 resistance zone against the US Dollar. The EUR/USD pair broke the 1.1920 and 1.1900 support levels to move into a bearish zone.

The pair even settled well below 1.1900 and the 50 hourly simple moving average. Recently, there was a break below a short-term ascending channel with support near 1.1865 on the hourly chart.


A low was formed near 1.1807 on FXOpen and the pair is now consolidating losses. An immediate resistance is near the 1.1828 level. It is near the 23.6% Fib retracement level of the recent decline from the 1.1894 high to 1.1807 low.

The first major resistance is near the 1.1850 level. It is near the 50% Fib retracement level of the recent decline from the 1.1894 high to 1.1807 low.

Any more gains could set the pace for a move towards the 1.1900 level. The next major resistance is near the 1.1950 level. On the downside, an immediate support is near the 1.1800 level.

If there is a downside break, EUR/USD might continue to move down towards the 1.1760 support. Any more losses could open the doors for a test of the 1.1700 region. An intermediate support could be near the 1.1720 level.


Read Full on FXOpen Company Blog...
 
Winners of Money Managers Forex Contest Announced


Money Managers, a Forex contest with real PAMM accounts, ended on June 30th, 2021.

We are now ready to announce the results:

1stplace and the $5,000 prize go to: rutnaomi.


2ndplace and the $3,000 prize go to: krutoy-bobr.


Read Full on FXOpen Company News...
 
LTC and EOS – Further lows expected


LTC/USD

The price of Litecoin reached $148 on the 4th of July which was the same level as on the prior high. From there we have seen the start of a descending move and is currently being traded at $130 and is still in a downward trajectory.


On the hourly chart, you can see that the price broke out from the ascending support level from the 22nd of June. This is the first signal that the prior recovery ended and now we have seen the start of a descending move of the same degree as the one that lasted from the 22nd of June till the 4th of July.

July 4th high came up to the descending trendline which is the upper level of the descending triangle which formed from the 23rd of May. As the price found resistance again this validated that the previous recovery was corrective in nature in conjunction with the wave structure. This is why it is counted as the 4th corrective wave with now most likely the 5th one to the downside developing.

If this is true then we are to see a lower low compared to the one on the 22nd of June when the price of Litecoin fell to $105 area. If the descending triangle is still in play another third interaction with its support level could be seen which brings the price target to $90.


Read Full on FXOpen Company Blog...
 
AUD/USD and NZD/USD Remain At Risk of More Downsides


AUD/USD started a fresh decline from well above the 0.7550 level. NZD/USD also declined heavily and it even tested the 0.6920 support zone.

Important Takeaways for AUD/USD and NZD/USD


  • The Aussie Dollar started a major decline after it failed to clear 0.7600 against the US Dollar.
  • There is a key bearish trend line forming with resistance near 0.7435 on the hourly chart of AUD/USD.
  • NZD/USD also started a major decline from well above the 0.7050 level.
  • There is a major bearish trend line forming with resistance near 0.6975 on the hourly chart of NZD/USD.

AUD/USD Technical Analysis

After struggling to clear the 0.7600 resistance, the Aussie Dollar started a major decline against the US Dollar. The AUD/USD pair broke the 0.7550 and 0.7520 support levels to move into a bearish zone.

The pair even broke the 0.7480 support and the 50 hourly simple moving average. It spiked below 0.7420 and traded as low as 0.7409 on FXOpen. It is now consolidating losses above the 0.7400 level.


An immediate resistance is near the 0.7430 level. It is near the 23.6% Fib retracement level of the recent decline from the 0.7533 swing high to 0.7409 low. There is also a key bearish trend line forming with resistance near 0.7435 on the hourly chart of AUD/USD.

The next major resistance is near the 0.7465 level and the 50 hourly SMA. The 50% Fib retracement level of the recent decline from the 0.7533 swing high to 0.7409 low is also near the 0.7470 level.

To move into a positive zone, the pair must settle above 0.7470 and the 50 hourly SMA. An initial support on the downside is near the 0.7410 level. The next major support is near the 0.7400 level. If there is a downside break below the 0.7400 support, the pair could extend its decline towards the 0.7350 level.


Read Full on FXOpen Company Blog...
 
GBP/USD Recovers Ground, USD/CAD is Facing Uphill Task


GBP/USD started a decent recovery wave from the 1.3750 support zone. USD/CAD must clear the 1.2500 resistance zone to continue higher in the near term.

Important Takeaways for GBP/USD and USD/CAD


  • The British Pound started a fresh increase from the 1.3750 support zone.
  • There was a break above a key bearish trend line with resistance near 1.3775 on the hourly chart of GBP/USD.
  • USD/CAD gained bullish momentum above the 1.2450 and 1.2500 resistance levels.
  • There is a major bearish trend line forming with resistance near 1.2480 on the hourly chart.

GBP/USD Technical Analysis

The British Pound formed a strong support base above the 1.3750 level against the US Dollar. As a result, the GBP/USD pair started a decent increase and it broke many hurdles near 1.3800.


There was a break above a key bearish trend line with resistance near 1.3775 on the hourly chart of GBP/USD. The pair gained pace above the 1.3820 level and the 50 hourly simple moving average.

The pair even spiked above the 1.3900 resistance zone. A high is formed near 1.3909 on FXOpen and the pair is now consolidating gains. An initial support on the downside is near the 1.3875 level. It is near the 23.6% Fib retracement level of the upward move from the 1.3755 swing low to 1.3909 high.

The main support is now forming near the 1.3830 level. It is close to the 50% Fib retracement level of the upward move from the 1.3755 swing low to 1.3909 high.

On the upside, the pair must settle above the 1.3900 level. The next major resistance is near the 1.3940 level. Any more gains could lead the pair towards the 1.4000 barrier in the near term. An intermediate resistance could be 1.3980.


Read Full on FXOpen Company Blog...
 
Bitcoin Gives Back Its 2021 Gains – What Next?


Bitcoin started the year around $30,000, and now the level acts as support. The euphoria surrounding the cryptocurrency market ended with a 50% decline in the price of Bitcoin and, in some cases, with more.

In the first quarter of the year, Tesla announced that it invested $1.5 billion into Bitcoin. Moreover, it said that it would accept payments for its vehicles in Bitcoin.

The announcement led to massive buying into the crypto space as numerous altcoins entered the bullish territory. As such, Bitcoin rose from $30,000 to over $60,000.

Investors viewed Tesla’s announcement as a sign of further adoption of the cryptocurrencies, thus the bullish run. However, a couple of months later, Tesla announced it had sold some of its Bitcoin holdings and booked a profit just before the end of the first quarter. In fact, the company made a profit on the quarter only from selling carbon credits and some of its Bitcoin holding.

Shortly after the second quarter started, Tesla, through the voice of its CEO, Elon Musk, expressed its concerns about the energy use of mining Bitcoin. As such, it stopped accepting Bitcoin as payment for Tesla cars, but it is unclear if the company sold any of its remaining Bitcoin.


Tesla Q2 Earnings – Key for Future Price Action in Bitcoin

It is unclear if Tesla sold any of its remaining Bitcoin or not, but investors will find out pretty soon. The Q2 2021 earnings season starts now, and investors will look for clues about the company’s crypt holding. If Tesla sold more of its Bitcoin at the higher levels, the bias is that the market will test below $30,000.

From a technical perspective, the market seems to have formed a head and shoulders pattern. Even the fact that the global Bitcoin mining energy use is comparatively negligible does not matter anymore, as the market is unable to bounce.

Moreover, further investments from companies such as MicroStrategy, which announced over $1.5 billion invested in Bitcoin in the second quarter alone, were not enough to lift the price of Bitcoin.

To sum up, if there is one critical event for Bitcoin in the weeks ahead, it is the Tesla Q2 2021 earnings. Any changes in the company’s crypto portfolio may move the market.


FXOpen Blog
 
EUR/USD Remains At Risk, USD/CHF Eyes Larger Increase


EUR/USD declined heavily below 1.1900 and it tested 1.1770. USD/CHF is rising and it could gain momentum if it manages to clear the 0.9200 resistance.

Important Takeaways for EUR/USD and USD/CHF


  • The Euro started a fresh decline from well above the 1.1900 zone against the US Dollar.
  • There was a break below a major contracting triangle with support near 1.1855 on the hourly chart of EUR/USD.
  • USD/CHF started a fresh increase after it found support near 0.9123.
  • There was a break above a key bearish trend line with resistance near 0.9168 on the hourly chart.

EUR/USD Technical Analysis

The Euro struggled to gain pace above the 1.1900 level and it started a major decline against the US Dollar. As a result, the EUR/USD pair broke the 1.1850 support zone to move into a bearish zone.

The pair even declined below the 1.1820 support zone and settled below the 50 hourly simple moving average. There was also a break below a major contracting triangle with support near 1.1855 on the hourly chart of EUR/USD.


A low was formed near 1.1772 on FXOpen and the pair is now consolidating losses. An immediate resistance on the upside is near the 1.1795 level.

It is near the 23.6% Fib retracement level of the recent drop from the 1.1875 high to 1.1772 low. If there is an upside break above the 1.1800 resistance zone, the price could recover steadily towards the 1.1825 resistance zone.

The 50% Fib retracement level of the recent drop from the 1.1875 high to 1.1772 low is also near 1.1825. Any more gains might call for a test of 1.1850.

On the downside, there is a major support forming near the 1.1770 zone. A downside break below the 1.1770 support could start another decline. The next major support could be near the 1.1710 level.


Read Full on FXOpen Company Blog...
 
Crypto investors are looking for reasons to be optimistic


The market has entered a consolidation zone after the anomalous activity of May 19, with fluctuations framed by a narrowing triangle formation. Currently, no significant news reports are affecting the market, and the volumes are fading. This situation is reminiscent of the calm before the storm. What will the storm be like and when will it happen?

Optimists are looking for arguments that would signify a resuming growth. Analysts point to the outflow of bitcoins from cryptocurrency exchanges (see fig. 2), as evidenced by data (see fig. 1) collected by the Glassnode agency. Blue arrows on the chart indicate that previous outflows occurred against the backdrop of rising quotes. Therefore, the current outflow, according to analysts, could be a bullish harbinger.


But digging deeper, we will find out that this was not always the case. A similar outflow occurred during the lull in the first half of November 2018. And in the second half, a bearish storm occurred, and BTCUSD collapsed from 6400 to 3200.

Volume analysis does give cause for concern. On July 11, there was a growth attempt (see fig. 3), but the volumes were low, which indicates a possible shortage of buyers. The next day, July 12, confirms the weakness of demand, as the price decreased on growing volumes, which can be interpreted as active selling pressure. It seems that negative sentiment prevails in the market, as participants are actively selling the coin instead of buying. If so, then the price of 33,500 is too high for BTC.

In such conditions, the fate of a psychological support level of 30k causes more and more concerns.


FXOpen Blog
 
LTC and EOS – Upside expected but could be correctional


LTC/USD

The price of Litecoin was on the rise from yesterday and came up by 6% from its low of $124.3 to $131.8 at its highest point today. We have seen a minor pullback to $127.6 and currently it started moving to the upside again.


On the hourly chart, you can see that yesterday’s low was the third lower low from the 29th of Jun. This could have marked the completion of the corrective ABC structure after a five-wave impulse from the 22nd of Jun. If this is true then the price is now set to continue moving to the upside in an impulsive manner.

Another possibility could be that the price made a three-wave increase from the 22nd till the 29th in which case we have seen a corrective ABCDE after, but in both cases, the price would be expected to continue moving higher. Either as the continuation of the corrective WXY of the higher degree in a negative scenario or the 3rd wave from the five-wave impulse in a positive one.

The pullback seen from yesterday is most likely the 2nd sub-wave of starting move to the upside so shortly a breakout would be expected from the descending resistance level and a higher high compared to yesterday’s one. Moving forward we are going to see from the price action which scenario is going to get validated.


Read Full on FXOpen Company Blog...
 

Create an account or login to comment

You must be a member in order to leave a comment

Create account

Create an account on our community. It's easy!

Log in

Already have an account? Log in here.

Similar threads

Users Who Are Viewing This Thread (Total: 1, Members: 0, Guests: 1)

Top
AdBlock Detected

We get it, advertisements are annoying!

Sure, ad-blocking software does a great job at blocking ads, but it also blocks useful features of our website. For the best site experience please disable your AdBlocker.

I've Disabled AdBlock    No Thanks