What's new

General About FXOpen – FXOpen.com

4.40 star(s) 7 Votes
GBP/USD Breaks Key Resistance, USD/CAD Extends Decline


GBP/USD started a fresh rally above the 1.4000 resistance. USD/CAD declined heavily below 1.2250 and it remains at a risk of more downsides.

Important Takeaways for GBP/USD and USD/CAD


  • The British Pound started a fresh increase from the 1.3800 support zone.
  • There was a break above a major contracting triangle with resistance near 1.3925 on the hourly chart of GBP/USD.
  • USD/CAD declined heavily after it broke the 1.2260 and 1.2250 support levels.
  • There is a key bearish trend line forming with resistance near 1.2200 on the hourly chart.

GBP/USD Technical Analysis

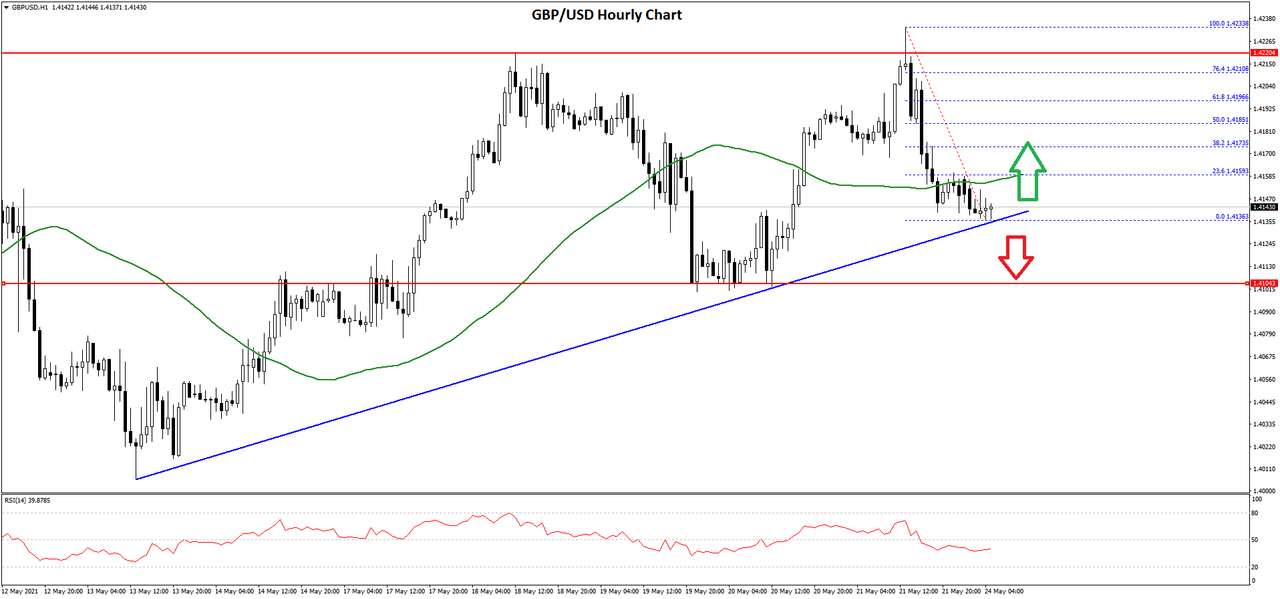
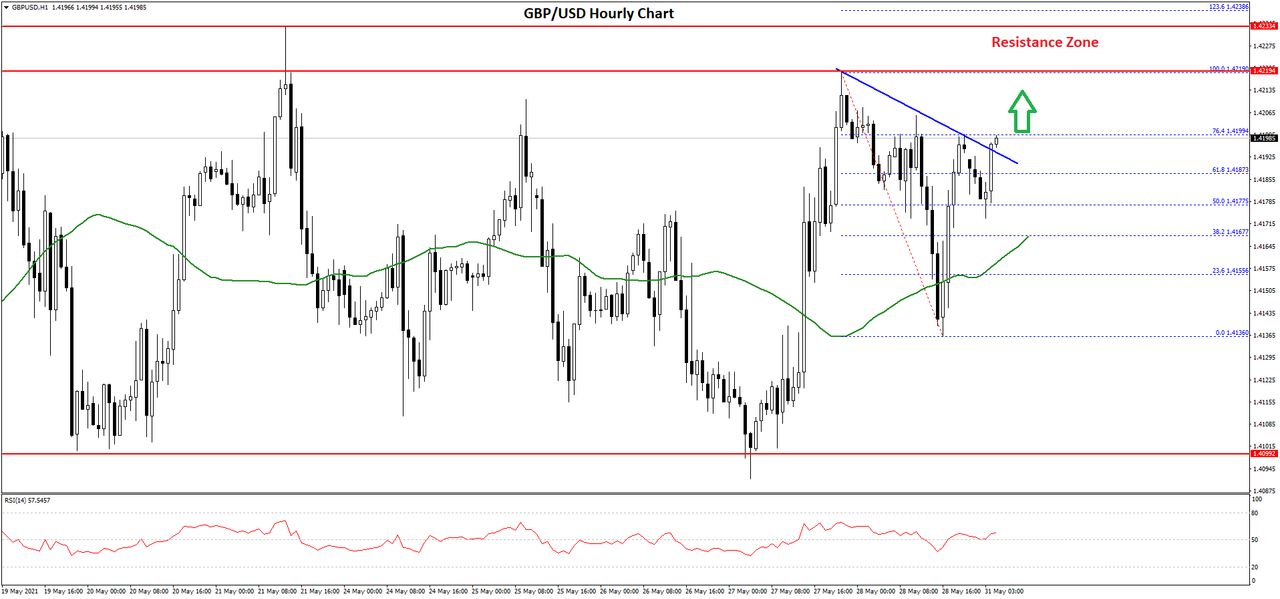
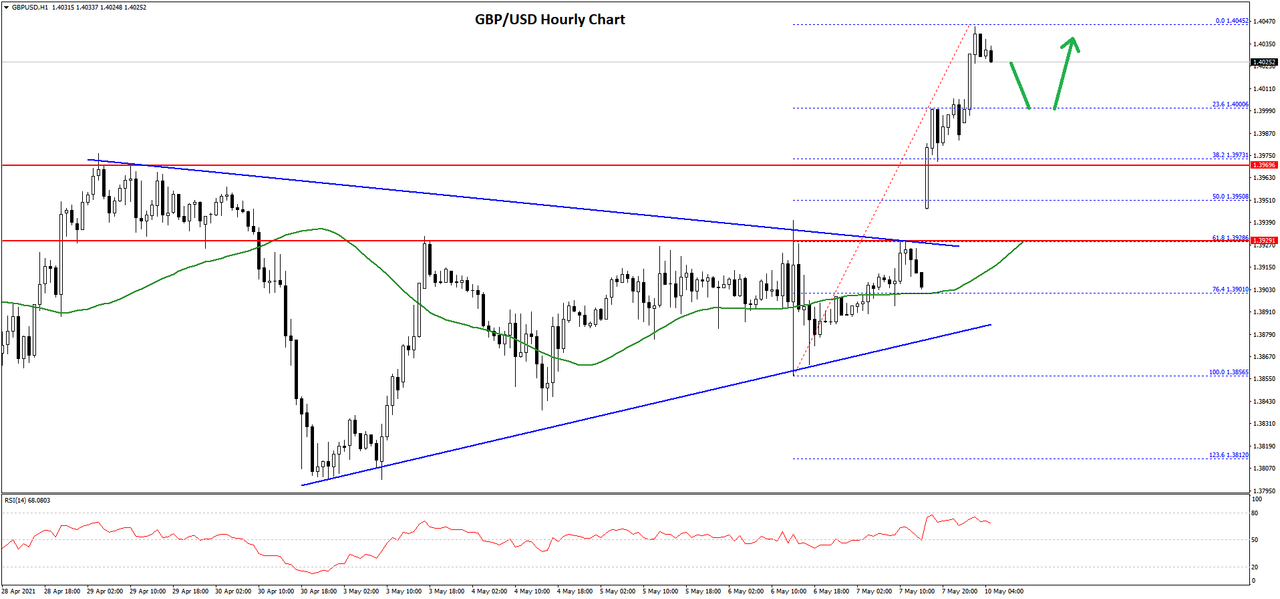
This past week, the British Pound consolidated above the 1.3820 and 1.3850 support levels against the US Dollar. Recently, the US NFP report was released, which posted a disappointing result of 266K.

As a result, the GBP/USD pair started a fresh increase and cleared a couple of important hurdles near the 1.3925 level. There was also a break above a major contracting triangle with resistance near 1.3925 on the hourly chart of GBP/USD.


The pair even climbed above the 1.4000 level and settled nicely above the 50 hourly simple moving average. It traded as high as 1.4045 on FXOpen and it is now consolidating gains.

An initial support on the downside is near the 1.4000 level. It is close to the 23.6% Fib retracement level of the upward move from the 1.3856 low to 1.4045 high. If the pair fails to stay above the 1.4000 level, it could correct lower towards the 1.3950 level.

The 50% Fib retracement level of the upward move from the 1.3856 low to 1.4045 high is also near 1.3950. Any more losses might call for a test of the 1.3925 support.

On the upside, the 1.4050 zone is an initial barrier for the bulls. A successful close above the 1.4045 and 1.4050 levels could open the doors for a steady increase towards 1.4120 or even 1.4200.


Read Full on FXOpen Company Blog...
 
Trading Hours Schedule for the Hong Kong Public Holiday on 19th May


Dear Traders,

Due to the Hong Kong Public Holiday on 19th May, you will experience the following changes in the trading hours schedule:

Hong Kong 50 (#HSI)

  • Tuesday, May 18th: 01:00 - 22:00;
  • Wednesday, May 19th: trading closed;
  • Thursday, May 20th: opening at 04:15.

All other financial instruments will be traded as usual.

Please take these changes into consideration when planning your trading activities for the upcoming week.

FXOpen Company News
 
Ethereum at Record Highs as the Cryptocurrency Traders Diversify from Bitcoin


The cryptocurrency market appears to have reached a point where investors look beyond Bitcoin. Up until recently, Bitcoin was the only game in town, responsible for the overall movements in other crypto coins.

However, things changed dramatically as Ethereum has recovered faster than Bitcoin from last month’s move lower. Investors may remember that Bitcoin dropped from over $60k to $47k in less than 24h, creating a similar move in most altcoins. However, it recovered but was not able to make a new high. Ethereum did and now trades above $4,000 for the first time in history.


Fears of Inflation Drive the Cryptocurrency Market Higher

Inflation in the United States is expected to rise in the months ahead. As such, commodity prices are close to record highs. Lumber, for example, rose over 500% in the last twelve months, and so are basic food commodities such as corn. Gold recovered from below $1,700 and now trades above $1,830, acting as a classic hedge against inflation.

But some investors diverted their attention also to new hedges against inflation. The digital assets are seen as such hedges, and this is why there is such a strong interest in the market.

Why would Ethereum outperform Bitcoin? Also, how about the interest in Dogecoin?

One explanation may come from the carbon footprint that mining Bitcoin has and the negative environmental effects of mining new coins. Natural gas, coal, and oil are still the main sources of electricity used at mining Bitcoin, and many investors want to move away from such investments. If you want, the process resembles, in a small way, sustainable investing.


It is not to say that the price of Bitcoin will not rise anymore or that it will correct from the current levels. This article only points out the fact that investors are willing to have a look at other digital assets in their wish to hedge against inflation.

Should the CPI later this week come out higher than expected, the cryptocurrency market may be the first one to react to such news. In the meantime, Ethereum continues to outperform Bitcoin, just like Dogecoin did in the past years.


FXOpen Blog
 
BTC and XRP – Correction likely to continue


The price of Bitcoin reached $59,544 at its highest point yesterday from its prior higher low of $53,170 on the 5th of May. This rise of 12.24% was stopped as the third unsuccessful attempt to surpass the zone above the $60,000 which is why we have seen a decrease of 10% measured to its lowest spike of $53,530. Currently, the price is being traded at around $55,440 as it managed to snap back quickly up above the significant horizontal level.


Now the price is looking for support as the breakout momentum has been seen strong. The descending move is counted as the second sub-wave of the higher degree count out of which further upside would be expected. However, we need to first see the price to hold above the $55,200 area for the scenario to still be valid. If the price goes below it, that would be an early indication that we are seeing further lows before another upward cycle.

The primary count implies that from the 26th of April we have seen another wave to the upside and it is still unclear where this current descending move belongs, but if it’s the part of the higher degree correction it could end below $53,400.

Read Full on FXOpen Company Blog...
 
EUR/USD Faces Key Hurdle, USD/CHF Starts Fresh Increase


EUR/USD seems to be struggling to clear the 1.2180 and 1.2200 resistance levels. USD/CHF is rising and it broke a major hurdle near the 0.9020 level.

Important Takeaways for EUR/USD and USD/CHF


  • The Euro is struggling to gain pace above the 1.2165 and 1.2180 levels against the US Dollar.
  • There is a key connecting bullish trend line forming with support near 1.2115 on the hourly chart of EUR/USD.
  • USD/CHF started a fresh increase after forming a base above the 0.8990 level.
  • There was a break above a major bearish trend line with resistance near 0.9032 on the hourly chart.

EUR/USD Technical Analysis

The Euro formed a strong support base above the 1.2000 level against the US Dollar. As a result, the EUR/USD pair started a fresh increase and it broke many hurdles near the 1.2050 and 1.2100 levels.

The pair even surged above the 1.2150 level and settled above the 50 hourly simple moving average. A high was formed near 1.2181 on FXOpen and the pair is now correcting gains. It seems like the pair is struggling to gain pace above the 1.2165 and 1.2180 levels.


It already corrected lower below the 1.2150 level and the 50 hourly simple moving average. There was a break below the 23.6% Fib retracement level of the upward move from the 1.2052 swing low to 1.2181 high.

On the downside, there is a major support forming near the 1.2120 zone. There is also a key connecting bullish trend line forming with support near 1.2115 on the hourly chart of EUR/USD.

The trend line is close to the 50% Fib retracement level of the upward move from the 1.2052 swing low to 1.2181 high. A downside break below the trend line and 1.2100 could increase selling pressure in the near term.

On the upside, the pair is facing hurdles near the 1.2180 level. The next major resistance is near the 1.2200 level, above which the pair could start a strong increase.


Read Full on FXOpen Company Blog...
 
FXOpen Leading April 2021 PAMM Accounts Overview


It’s May 2021 already, so it’s high time we took a look at where we ended up in April. Our latest review of PAMM accounts is meant to help investors navigate the rating of FXOpen’s PAMM account managers and form their portfolio by choosing what’s best for them based on profitability and outlook reports.

As of now, 160 manager accounts have been registered with FXOpen, with the accumulated investment capital in the amount of US$2,912,991.00.

Read Full on FXOpen Company Blog...
 
LTC and EOS – Consolidation now expected but further decline still a possibility


LTC/USD

The price of Litecoin has been on a decline from yesterday’s high of $391 made a decrease of 21.8% as it fell to $306.35 at its lowest point today. It spiked further down buy managed to snap back quickly and is currently being traded at $313.69.


Looking at the hourly chart, you can see that this downfall was the continuation of the descending move from Monday when the price reached $411 at its highest. This was most likely the end of the higher degree 3rd wave from the impulse wave that started at the start of the year. If so, we are now seeing the 4th wave of the same degree developing to the downside. Measured from its last increase from the 26th of April the price fell down to the 0.5 Fib level and found support there. But this only might be a temporary hold before further downside continuation.

We could have seen the completion of the ABC correction in which case now we are to see the start of the next 5th wave to the upside, but there isn’t still any signs of the buyers entering the market. If we are to see the start of the next impulsive move strong confirmation would be needed.


Read Full on FXOpen Company Blog...
 
US April Inflation – Four Times Higher Than Market Expectations


Last Wednesday, the Consumer Price Index (CPI) in the United States showed that inflation runs hot in the largest economy in the world. On expectations of an increase of 0.2% on a monthly basis, the headline CPI came out four times higher.

Moreover, the Core CPI, which tracks the changes in the price of goods and services over a period, without accounting for food and energy, was three times higher in April than the market expected. As such, inflation is running hot in America, and the whole world is watching.

[


A Comparison With the 1970s

Back in the 1970s, inflation in America was printing double-digits on a monthly basis. The Fed fought a long battle to bring inflation down, mainly by raising the interest rates on the world’s reserve currency.

This was a problematic thing to do at the time, because the US just gave up the gold standard. In other words, for the world to still trust the dollar without gold backing, the Fed stepped in and offered a higher interest rate.

Fast forward to our times, and the Fed is unlikely to do the same despite rising inflation, for several reasons. First, the Fed changed its inflation mandate last year.

We should mention here that the Fed has a dual mandate – price stability and job creation. For the first part of its mandate, it used an inflation-targeting framework for decades. Its aim was to create inflation close to the 2% target. This is similar to what other central banks in the world use, like the ECB, which aims at inflation below, but close to 2%.

But the Fed chose to change the inflation-targeting framework last year. It announced that it no longer considers price stability at 2% inflation, but around 2% inflation.

More precisely, the Fed averages inflation for a period, aiming at 2%. The problem is that the period considered is unknown to the market participants.

In April this year, inflation exceeded the Fed’s 2% by a mile, if we consider the annualized data. Yet, the Fed says that the data is transitory. Indeed, if we average inflation for the past six or twelve-month, the result is way below the 2% level. Hence, the Fed is right in adopting a wait-and-see approach.


Yet, more money is in the pipeline. The chart above shows the US Treasury cash balance at the Federal Reserve. Effectively, this is money held at the Fed, used by the US government to finance various projects or to support its fiscal expansion policy.

Close to a trillion dollars are still available to be deployed into the US economy. Therefore, inflation is likely to run even higher in the months ahead.

The question, at this point, is how much higher will inflation go, without the Fed to intervene? Also, how will the financial markets react?

The initial reaction to the higher inflation data last Wednesday showed weakness in the US equity markets. But that weakness reversed in the following two trading days, as the main stock indices recovered most of the lost ground in the two days left in the trading week.

However, if we use the 1970s as a benchmark, higher inflation triggers an equity bear market. Will we see one in 2021?


FXOpen Blog
 
BTC and XRP – Further downside looks more likely


BTC/USD

The price of Bitcoin has been on a decline since the 10th of May when it reached a high of $59,512. From there we have seen a decrease of 29.3% so far as it fell down to $42,180 at its lowest point. It is currently retesting those low levels for support and it appears to have stabilized as it made another attempt to continue its downward trajectory but bounced off of the low levels. Now it is moving slightly to the upside and is being traded at $44,923.


Looking at the hourly chart above, we can see that this down move from the 10th is the continuation of the decrease that started from the 14th of April after the price reached a new all-time high. As it is most likely the 3rd sub-wave of the corrective ABC this could mean that the descending move has ended on the current interaction with the significant horizontal support zone.

However, if this is the 4th wave of the cycle degree the correction might get deeper and prolonged. In this case, these first three waves could be prolonged by another two more either as the WXYXZ complex correction or in the worst-case scenario a five-wave impulse that would only be the 1st sub-wave of the higher degree ABC.

We are shortly going to see from the expected upward move and the following pullback which scenario could be more likely but for now the primary one is that the downfall could have ended as the ABC move.


Read Full on FXOpen Company Blog...
 
GBP/USD Extends Rally, EUR/GBP Eyes Steady Recovery


GBP/USD remained strong above 1.4000 and it recently climbed above 1.4200. EUR/GBP is correcting higher and it is aiming a break above 0.8640.

Important Takeaways for GBP/USD and EUR/GBP


  • The British Pound formed a strong support base above 1.4050 and climbed above 1.4150.
  • There is a key bullish trend line forming with support near 1.4155 on the hourly chart of GBP/USD.
  • EUR/GBP started a fresh increase and it is trading above the 0.8600 zone.
  • There is a major rising channel forming with resistance near 0.8640 on the hourly chart.

GBP/USD Technical Analysis

After finding a strong buying interest near 1.4000, the British Pound started a fresh increase against the US Dollar. The GBP/USD pair gained pace and it broke the 1.4100 resistance zone.

The upward move gained pace above the 1.4150 level and the 50 hourly simple moving average. It even broke the 1.4200 zone and traded as high as 1.4220 on FXOpen. It is now correcting gains and trading below the 1.4200 level.


It broke the 23.6% Fib retracement level of the upward move from the 1.4077 swing low to 1.4220 high. On the downside, the first key support is near the 1.4165 level.

The main support is now forming near the 1.4150 level. There is also a key bullish trend line forming with support near 1.4155 on the hourly chart of GBP/USD. The trend line is close to the 50% Fib retracement level of the upward move from the 1.4077 swing low to 1.4220 high.

The 50 hourly simple moving average is also near the 1.4155 zone. If there is a downside break below the trend line, the pair could decline towards the 1.4100 support.

On the upside, an immediate resistance is near the 1.4200 level. The next major resistance is near the 1.4220 level. A successful close above 1.4000 and a follow up move above 1.4220 could open the doors for a move towards the 1.4280 resistance.


Read Full on FXOpen Company Blog...
 
Dear Traders,

Due to the Memorial Day in the US and the UK Spring Bank Holiday on 31st May, you will experience the following changes in the trading hours schedule:

Friday, May 28th, 2021

Indices CFD:


  • UK 100 (#UK100): 01:00 – 23:00.

All other markets will be open for trading as usual.

Monday, May 31st, 2021

Metals and Commodities CFD:


  • Gold (XAUUSD): 01:00 – 20:00;
  • Silver (XAGUSD): 01:00 – 20:00;
  • UK Brent (XBRUSD): 03:00 – 19:45
  • US Crude (XTIUSD): 01:00 – 19:45;
  • US Natural Gas (XNGUSD): 01:00 – 19:45.

Indices CFD:

  • Japan 225 (#J225): 01:00 – 20:00;
  • UK 100 (#UK100): trading closed;
  • US SPX 500 mini (#SPXm): 01:00 – 20:00;
  • US Tech 100 mini (#NDXm): 01:00 – 20:00;
  • Wall Street 30 mini (#WS30m): 01:00 – 20:00.

Stocks CFD: trading closed.

All other markets will be open for trading as usual.

Tuesday, June 1st, 2021

Indices CFD:


  • UK 100 (#UK100): opening at 03:00.

All other markets will be open for trading as usual.

Please take these changes into consideration when planning your trading activities for the upcoming week.

FXOpen Company News
 
LTC and EOS – Have we seen the completion of the downfall?


LTC/USD

The price of Litecoin has been on a decline since the 10th of May when it reached $413 at its highest point. From there we have seen a decrease of 64.88% as it fell to $145 at its lowest point yesterday. We have seen a recovery taking place with the price currently being traded at $211 and is still in an upward trajectory.


On the hourly chart, you can see that the price has made a lower low today, compared to yesterday’s candle close, and is now still above yesterday’s high. This is still a negative sign even though recovery has been seen. We could bee saw the 4th corrective wave out of the five-wave impulse to the downside from the 16th which is still in development. If this is true then the price would be headed downwards after this increase ends for another establishment of support around the $165 area.

In another move positive scenario the decrease ended with today’s recovery being the 1st sub-wave of the next five-wave impulse to the upside. Even so a retracement would be expected and first a surpassing of yesterday’s high so for the pullback that is expected to follow we can evaluate these possibilities.


Read Full on FXOpen Company Blog...
 
AUD/USD and NZD/USD Remain At Risk of More Losses


AUD/USD failed to clear the 0.7800 resistance and corrected lower. NZD/USD is likely to decline further if there is a break below the 0.7180 level.

Important Takeaways for AUD/USD and NZD/USD


  • The Aussie Dollar is struggling to gain pace above 0.7800 zone against the US Dollar.
  • There is a major bearish trend line forming with resistance near 0.7775 on the hourly chart of AUD/USD.
  • NZD/USD corrected lower after it failed to surpass the 0.7270 resistance zone.
  • There is a key contracting triangle forming with support near 0.7180 on the hourly chart of NZD/USD.

AUD/USD Technical Analysis

Recently, the Aussie Dollar attempted an upside break above the 0.7800 resistance against the US Dollar. The AUD/USD pair failed to settle above 0.7800 and started a fresh decline.

It broke the 0.7750 support level and tested the 0.7710 level. A low was formed near 0.7710 on FXOpen and it recently there was an upside correction. The pair climbed above 0.7750 and the 50 hourly simple moving average.


However, it is struggling to clear the 0.7780 level. A high is formed near 0.7781 and the pair is now correcting lower. There was a break below the 23.6% Fib retracement level of the upward move from the 0.7710 swing low to 0.7781 high.

The pair is now trading near the 0.7755 level and the 50 hourly simple moving average. There is also a major bearish trend line forming with resistance near 0.7775 on the hourly chart of AUD/USD.

On the upside, there is a major resistance forming near the 0.7780 and 0.7800 levels. A successful break above the trend line and the 0.7800 zone is must for a steady increase. The next major resistance could be 0.7840, above which the price could rise towards the 0.7880 resistance.

Conversely, the pair could decline below the 0.7750 support zone. The next major support is near the 0.7725 level. If there is a downside break below the 0.7725 level, the pair could extend its decline towards the 0.7680 level.


Read Full on FXOpen Company Blog...
 
GBP/USD Holding Uptrend Support, GBP/JPY Eyes Additional Gains


GBP/USD found support near 1.3825 and it is now showing positive signs. GBP/JPY is stable above 149.40 and it is now facing hurdles near 150.00.

Important Takeaways for GBP/USD and GBP/JPY


  • The British Pound extended its increase above the 1.4200 region against the US Dollar.
  • There is a major bullish trend line forming with support near 1.4135 on the hourly chart of GBP/USD.
  • GBP/JPY is correcting gains from the 155.00 resistance zone.
  • There is a key bearish trend line forming with resistance near 154.40 on the hourly chart.

GBP/USD Technical Analysis

In the past few sessions, the British Pound saw a steady increase above the 1.4000 zone against the US Dollar. The GBP/USD pair broke the 1.4100 level and extended its upward move.

There was even a break above the 1.4200 resistance zone. A high was formed near 1.4233 on FXOpen and the pair is currently correcting gains. It broke the 1.4200 and 1.4180 support levels.


There was also a spike below the 1.4150 level and the 50 hourly simple moving average. A low is formed near 1.4136 and the pair is now consolidating. There is also a major bullish trend line forming with support near 1.4135 on the hourly chart of GBP/USD.

On the upside, an immediate resistance is near the 1.4160 level and the 50 hourly simple moving average. It is close to the 23.6% Fib retracement level of the recent decline from the 1.4233 high to 1.4136 low.

The first major resistance is near the 1.4185 level. The 50% Fib retracement level of the recent decline from the 1.4233 high to 1.4136 low is also near the 1.4185 level. Any more gains could set the pace for a strong rally above the 1.4200 level.

Conversely, the pair could break the trend line support and continue lower below 1.4135. The next major support is near the 1.4100 level. If there are additional losses, the pair could decline towards the 1.4000 level.


Read Full on FXOpen Company Blog...
 
Cryptocurrencies Tumble in April – What Comes Next?


Over the weekend, the cryptocurrency market took another tumble. Bitcoin fell more than 10% and tested the $32k level before bouncing. Also, Ethereum and other cryptocurrencies have lost more, with most of the coins down over 50% in April.

It all started with Elon Musk, the CEO of Tesla, tweeting at the start of the trading month that the company will not accept Bitcoin as payment for the purchasing of its electric vehicles. As such, Bitcoin collapsed, and other digital assets followed the same path.


Is It the First Time When Bitcoin Drops That Much?

A quick check at the Bitcoin’s price history reveals that such a drop is actually part of the way the asset moves. Throughout history, Bitcoin lost over 80% of its value three times – in 2013, 2016, and 2018.

Some other times, it frequently lost more than 40% of its value. Yet, Bitcoin did found its way out of it, although the volatility is not for the everyone.


If we look at what happened in May so far, Bitcoin’s price corrected from over $60k close to $30k. That is a drop of 50% in less than a month.

This is a problem not only for the crypto assets but for traditional financial assets too. One must remember how Bitcoin’s adoption has increased among institutional investors lately, and such a drop may end up posing a systemic risk to markets.

It did not, so far, as the equity markets remain stable. However, the declines in some crypto assets are so steep that institutional investors that adopted crypto have some explaining to do to their clients.

All in all, the move lower in Bitcoin is not unusual if we check historical prices. The only thing that is different at this point is that the move lower does not affect only retail traders anymore but also institutional investors. If the bearish market continues, the risk of seeing some spillovers in the traditional markets increases exponentially.


FXOpen Blog
 
BTC and XRP – Starting impulse to the upside likely developing


BTC/USD

The price of Bitcoin has recovered significantly from Sunday’s low of around $32,000 as it made an increase of 27% measured to its highest point today at $39.723. Since then we have seen a minor pullback with the price currently being traded at $37,896 and moving to the downside again.

On the hourly chart, you can see that the price made a five-wave increase from Sunday and came slightly above the significant horizontal level that served as support now turned resistance. This is why the price struggled to keep up its upward trajectory and is now headed to the downside again.


From Sunday we have most likely seen the start of the next move to the upside as the corrective ABC of the highest degree ended. If this is true, then we are now seeing the first sub-wave of the next five-wave impulse coming to completion as is why the currently seen downside move would be expected to continue pushing the price further down. That would be expected to develop as the 2nd sub-wave of the higher degree count and it should now form a higher low compared to Sunday’s one, potentially around $36,000 where the next horizontal support is in line. But from there further upside movement would be expected and a breakout above the $42,000 horizontal zone.


Read Full on FXOpen Company Blog...
 
EUR/USD Eyes Additional Gains, USD/JPY Remains At Risk


EUR/USD is gaining pace above the 1.2200 resistance zone. USD/JPY is showing bearish signs below the 108.85 and 109.00 resistance levels.

Important Takeaways for EUR/USD and USD/JPY


  • The Euro started a fresh increase above the 1.2200 resistance zone.
  • There is a key bullish trend line forming with support near 1.2240 on the hourly chart of EUR/USD.
  • USD/JPY declined below the 109.20 and 109.00 support levels.
  • There is a major bearish trend line forming with resistance near 109.00 on the hourly chart.

EUR/USD Technical Analysis

After forming a base above the 1.2050 level, the Euro started a fresh increase against the US Dollar. The EUR/USD pair broke the 1.2150 resistance level to move into a positive zone.

The pair even broke the 1.2200 level and settled nicely above the 50 hourly simple moving average. A high is formed near 1.2263 on FXOpen and the pair is now consolidating gains. It corrected lower below the 1.2250 support zone.


There was a break below the 23.6% Fib retracement level of the recent wave from the 1.2160 swing low to 1.2263 high. However, the pair is holding the 1.2200 support zone.

There is also a key bullish trend line forming with support near 1.2240 on the hourly chart of EUR/USD. If there is a downside break below the trend line, the pair could test the 1.2210 zone. It is near the 50% Fib retracement level of the recent wave from the 1.2160 swing low to 1.2263 high.

An intermediate support is near the 1.2225 level and the 50 hourly simple moving average. On the upside, the pair is likely to accelerate higher if it clears 1.2265. The next major resistance is near the 1.2300 level. Any more gains could lead the pair towards the 1.2350 level. An intermediate resistance might be near the 1.2320 level.


Read Full on FXOpen Company Blog...
 
LTC and EOS – At key turning point


LTC/USD

The price of Litecoin has been on the rise since the 23rd when it fell down to $128.32 at its lowest point. From there we have seen an increase of 58% measured to its highest point yesterday at around $203. Since then a minor pullback was made but the price is once again in an upward trajectory and is currently being traded at $196.3.


On the hourly chart, you can see that from the 23rd of May we have seen an impulsive five-wave move after which the price started consolidating. It did so in a three-wave manner which is most likely the 2nd sub-wave of the next higher degree impulse to the upside. We have seen the completion of a 3-3-5 move with a higher low made today compared to the one on the 25th as the first pullback which validated that the support is getting higher and that buyers are stepping in.

If this was a running flat correction that ended now today we have seen the start of the next wave to the upside which is set to exceed the high on the 25th and propel the price much stronger potentially to the territory of the 0.5 Fib level at around $264.65. But if this is the five-wave impulse of the higher degree it should continue moving to the upside beyond that point after another pullback on the 4th wave.


Read Full on FXOpen Company Blog...
 
Gold Price and Oil Price Turn Attractive On Dips


Gold price traded above the $1,900 resistance zone before correcting lower. Crude oil price is rising and it is trading nicely above the $65.00 pivot level.

Important Takeaways for Gold and Oil


  • Gold price gained pace above the $1,850 and $1,880 resistance levels against the US Dollar.
  • There is a key contracting triangle forming with resistance near $1,898 on the hourly chart of gold.
  • Crude oil price climbed higher and it cleared the $67.00 resistance zone.
  • There is a major bullish trend line forming with support near $66.00 on the hourly chart of XTI/USD.

Gold Price Technical Analysis

This week, gold price started a steady increase above the $1,850 level against the US Dollar. It broke a few key hurdles near $1,880 to move further into a positive zone.

The price even settled above the $1,880 zone and the 50 hourly simple moving average. There was a clear break above the $1,900 level and a high was formed near $1,912 on FXOpen. The price is now correcting gains and trading below $1,900.


There was a break below $1,890, but downsides were limited. The price traded as low as $1,888 and the price is now consolidating. It seems like there is a key contracting triangle forming with resistance near $1,898 on the hourly chart of gold.

The triangle resistance is near the 38.2% Fib retracement level of the recent decline from the $1,912 high to $1,888 low. The main resistance is now forming near the $1,900 level and the 50 hourly simple moving average.

The 50% Fib retracement level of the recent decline from the $1,912 high to $1,888 low is also near the $1,900 zone. A clear break above the $1,900 level may possibly open the doors for a move towards the $1,920 level or even $1,935.

On the downside, the price is likely to find bids near $1,888. If there is a downside break below $1,888, there are chances of a move towards the $1,870 level in the near term.


Read Full on FXOpen Company Blog...
 
GBP/USD Remains In Uptrend, USD/CAD Could Extend Losses


GBP/USD is holding gains above the 1.4100 and 1.4120 support levels. USD/CAD is struggling and it could decline further if it breaks the 1.2060 support.

Important Takeaways for GBP/USD and USD/CAD


  • The British Pound started a fresh increase above the 1.4100 resistance level.
  • There was a break above a key bearish trend line with resistance near 1.4190 on the hourly chart of GBP/USD.
  • USD/CAD declined steadily after it failed to clear the 1.2140 resistance zone.
  • There is a major bullish trend line forming with support near 1.2070 on the hourly chart.

GBP/USD Technical Analysis

The British Pound remained well bid above the 1.4080 and 1.4100 support levels against the US Dollar. The last swing low was formed near 1.4100 before the GBP/USD started a fresh increase.

The recent low was formed near 1.4136 on FXOpen and the pair is now rising steadily. It broke the 1.4150 resistance level and the 50 hourly simple moving average. There was a break above the 50% Fib retracement level of the downward move from the 1.4219 high to 1.4136 low.


There was also a break above a key bearish trend line with resistance near 1.4190 on the hourly chart of GBP/USD. The pair is now trading nicely above the 1.4180 level.

It is testing the 76.4% Fib retracement level of the downward move from the 1.4219 high to 1.4136 low. A clear break above the 1.4200 resistance level could open the doors for a larger increase. In the stated case, the pair could rise towards the 1.4220 resistance.

The next major resistance is near 1.4235, above which GBP/USD might test the 1.4300 zone. An initial support on the downside is near the 1.4180 level.

The first major support is near the 1.4165 level and the 50 hourly simple moving average. Any more losses could open the doors for a move towards the 1.4120 support zone.


Read Full on FXOpen Company Blog...
 

Create an account or login to comment

You must be a member in order to leave a comment

Create account

Create an account on our community. It's easy!

Log in

Already have an account? Log in here.

Similar threads

Users Who Are Viewing This Thread (Total: 1, Members: 0, Guests: 1)

Top
AdBlock Detected

We get it, advertisements are annoying!

Sure, ad-blocking software does a great job at blocking ads, but it also blocks useful features of our website. For the best site experience please disable your AdBlocker.

I've Disabled AdBlock    No Thanks