FXGlory Ltd
Member
GBPUSD Technical and Fundamental Analysis for 08.21.2025

Time Zone: GMT +3
Time Frame: 4 Hours (H4)
Fundamental Analysis
The GBPUSD currency pair is anticipating significant volatility due to today's scheduled economic events. For GBP, investors will closely monitor the public sector net borrowing data from the Office for National Statistics, which will indicate fiscal stability. Furthermore, the manufacturing and services PMI figures from S&P Global and the CBI Industrial Trends Survey are critical for assessing the UK's economic outlook. For the USD, traders will focus on Federal Reserve Bank of Atlanta President Raphael Bostic's speech and key economic indicators such as Initial Jobless Claims, Manufacturing and Services PMI, Philadelphia Fed Manufacturing Index, and Existing Home Sales. These events collectively could induce notable volatility in GBPUSD, guiding future monetary policy expectations.
Price Action
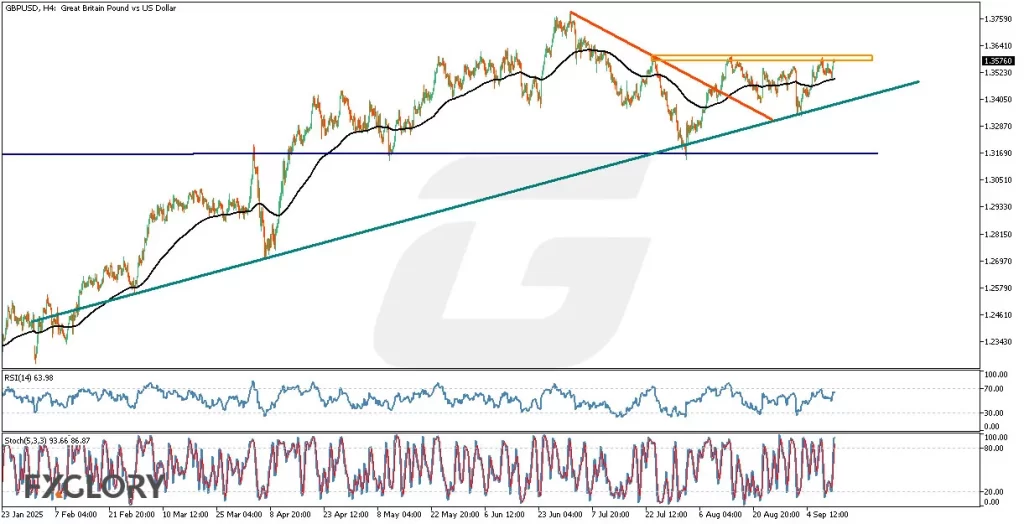
Analyzing GBPUSD in the H4 timeframe reveals a persistent bullish trend since 2022. Recently, the price successfully breached the resistance line of the most recent correction and is currently testing a significant support zone around 1.34568. The price action indicates potential bullish momentum towards the recent high at 1.37600. The proximity of RSI to oversold levels (near 30) further supports expectations for a reversal and continuation of the bullish trend.
Key Technical Indicators
RSI (14): Currently at 36.39, RSI is approaching oversold territory, suggesting that GBPUSD may soon experience a bullish reversal. Traders should be prepared for potential buying opportunities as the RSI crosses upward from the 30 level.
MACD: The MACD is currently showing readings of -0.001429 and -0.000760. Although still negative, the narrowing gap between the MACD line and the signal line suggests weakening bearish momentum, setting the stage for a potential bullish crossover.
Stochastic Oscillator: Stochastic values at 17.72 and 31.81 indicate the currency pair is significantly oversold. Such conditions typically precede a bullish reversal, highlighting favorable conditions for GBPUSD longs.
Support and Resistance Levels
Support: Immediate strong support is observed at the current price level of approximately 1.34568. Below this, the next critical support lies around the 1.34100 zone.
Resistance: The nearest resistance levels are found at 1.35820, followed by the significant psychological barrier at 1.37600, representing the recent major high.
Conclusion and Consideration
The technical analysis of GBPUSD in the H4 timeframe indicates favorable conditions for a bullish reversal from the current support zone. Key technical indicators like RSI, MACD, and Stochastics reinforce the bullish outlook, especially as price nears oversold conditions. However, traders must remain cautious given the potential market volatility from today's key economic data releases affecting both GBP and USD. It's advisable to await confirmed bullish signals before committing to long positions.
Disclaimer: The analysis provided for GBP/USD is for informational purposes only and does not constitute investment advice. Traders are encouraged to perform their own analysis and research before making any trading decisions on GBPUSD. Market conditions can change quickly, so staying informed with the latest data is essential.
FXGlory
08.21.2025
Time Zone: GMT +3
Time Frame: 4 Hours (H4)
Fundamental Analysis
The GBPUSD currency pair is anticipating significant volatility due to today's scheduled economic events. For GBP, investors will closely monitor the public sector net borrowing data from the Office for National Statistics, which will indicate fiscal stability. Furthermore, the manufacturing and services PMI figures from S&P Global and the CBI Industrial Trends Survey are critical for assessing the UK's economic outlook. For the USD, traders will focus on Federal Reserve Bank of Atlanta President Raphael Bostic's speech and key economic indicators such as Initial Jobless Claims, Manufacturing and Services PMI, Philadelphia Fed Manufacturing Index, and Existing Home Sales. These events collectively could induce notable volatility in GBPUSD, guiding future monetary policy expectations.
Price Action
Analyzing GBPUSD in the H4 timeframe reveals a persistent bullish trend since 2022. Recently, the price successfully breached the resistance line of the most recent correction and is currently testing a significant support zone around 1.34568. The price action indicates potential bullish momentum towards the recent high at 1.37600. The proximity of RSI to oversold levels (near 30) further supports expectations for a reversal and continuation of the bullish trend.
Key Technical Indicators
RSI (14): Currently at 36.39, RSI is approaching oversold territory, suggesting that GBPUSD may soon experience a bullish reversal. Traders should be prepared for potential buying opportunities as the RSI crosses upward from the 30 level.
MACD: The MACD is currently showing readings of -0.001429 and -0.000760. Although still negative, the narrowing gap between the MACD line and the signal line suggests weakening bearish momentum, setting the stage for a potential bullish crossover.
Stochastic Oscillator: Stochastic values at 17.72 and 31.81 indicate the currency pair is significantly oversold. Such conditions typically precede a bullish reversal, highlighting favorable conditions for GBPUSD longs.
Support and Resistance Levels
Support: Immediate strong support is observed at the current price level of approximately 1.34568. Below this, the next critical support lies around the 1.34100 zone.
Resistance: The nearest resistance levels are found at 1.35820, followed by the significant psychological barrier at 1.37600, representing the recent major high.
Conclusion and Consideration
The technical analysis of GBPUSD in the H4 timeframe indicates favorable conditions for a bullish reversal from the current support zone. Key technical indicators like RSI, MACD, and Stochastics reinforce the bullish outlook, especially as price nears oversold conditions. However, traders must remain cautious given the potential market volatility from today's key economic data releases affecting both GBP and USD. It's advisable to await confirmed bullish signals before committing to long positions.
Disclaimer: The analysis provided for GBP/USD is for informational purposes only and does not constitute investment advice. Traders are encouraged to perform their own analysis and research before making any trading decisions on GBPUSD. Market conditions can change quickly, so staying informed with the latest data is essential.
FXGlory
08.21.2025