FXOpen Trader
Active Member
US Consumers Spent Less Than Expected in December
The first two trading weeks of the new year are behind us, and investors have received and digested the last pieces of economic data for the just-concluded year. In the first trading week, the NFP (or non-farm payrolls) disappointed – the US economy added fewer jobs in December than the market expected.
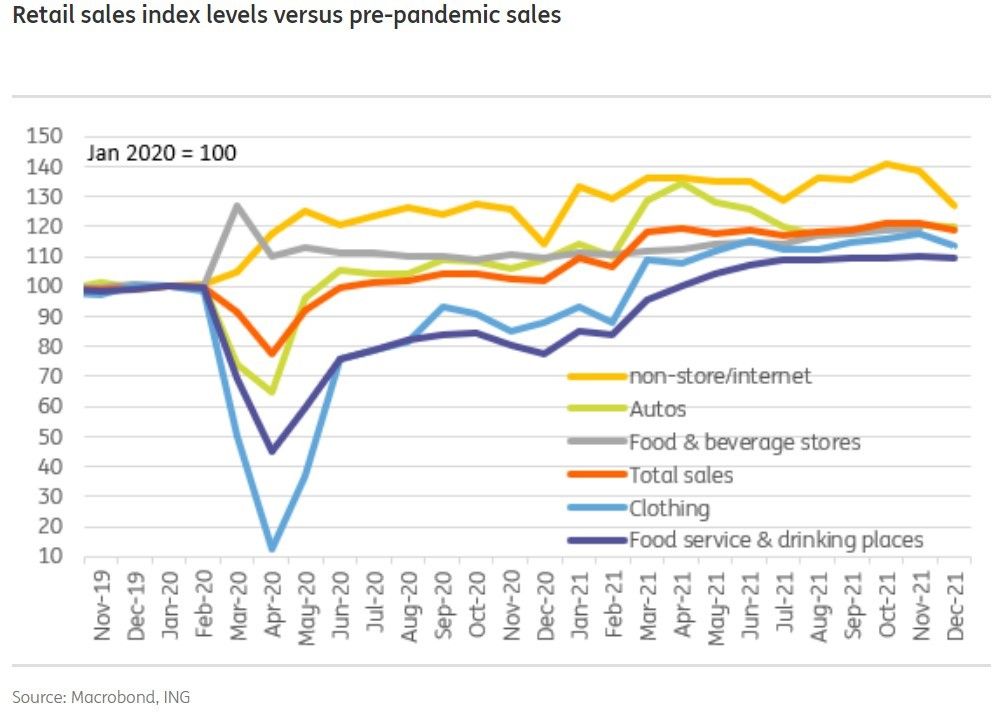
The same can be said about the retail sales data for December released last Friday. Against the expectations of +0.2%, the core retail sales, the ones that exclude automobiles, fell by -2.3%.
In other words, the US consumer is cautious, and uncertainty is triggering a big pullback in spending. Inflation is eroding demand, and supply issues for goods remain persistent. Moreover, labor supply constraints and omicron fear are affecting consumer spending.
With only a week away ahead of the Fed’s January meeting, is the Fed going to hike into a slowing economy?
Fed signaled the start of a new tightening cycle
The monetary policy in the US is closely watched by the developed economies. It often acts as a benchmark for other central banks, which quickly follow in the Fed’s footsteps.
The Fed is currently engaged in tapering its asset purchases. Effectively, it means that it still eases the monetary policy, albeit at a slower pace, despite inflation running hot at four decades high.
As such, with interest rates at the lower boundary and inflation so high, many fear that the Fed is trapped. The tapering is supposed to end in March, and so the institution cannot raise the federal funds rate at its January meeting.
However, the January meeting is important as the forward guidance may change. So far, a 25 basis points rate hike is in the cards, but one should not be surprised if the Fed is more aggressive.
In order to regain credibility in the face of rising inflation, the Fed may decide to shock the market with a 50 basis points rate hike. In any case, the January meeting will bring more details regarding what the Fed might do in March.
As such, the US dollar should be supported on dips.
The problem comes from the economic slowdown. By March, the economic growth may weaken considerably, and so the Fed may be forced to hike while the economy cools.
FXOpen Blog
The first two trading weeks of the new year are behind us, and investors have received and digested the last pieces of economic data for the just-concluded year. In the first trading week, the NFP (or non-farm payrolls) disappointed – the US economy added fewer jobs in December than the market expected.
The same can be said about the retail sales data for December released last Friday. Against the expectations of +0.2%, the core retail sales, the ones that exclude automobiles, fell by -2.3%.
In other words, the US consumer is cautious, and uncertainty is triggering a big pullback in spending. Inflation is eroding demand, and supply issues for goods remain persistent. Moreover, labor supply constraints and omicron fear are affecting consumer spending.
With only a week away ahead of the Fed’s January meeting, is the Fed going to hike into a slowing economy?
Fed signaled the start of a new tightening cycle
The monetary policy in the US is closely watched by the developed economies. It often acts as a benchmark for other central banks, which quickly follow in the Fed’s footsteps.
The Fed is currently engaged in tapering its asset purchases. Effectively, it means that it still eases the monetary policy, albeit at a slower pace, despite inflation running hot at four decades high.
As such, with interest rates at the lower boundary and inflation so high, many fear that the Fed is trapped. The tapering is supposed to end in March, and so the institution cannot raise the federal funds rate at its January meeting.
However, the January meeting is important as the forward guidance may change. So far, a 25 basis points rate hike is in the cards, but one should not be surprised if the Fed is more aggressive.
In order to regain credibility in the face of rising inflation, the Fed may decide to shock the market with a 50 basis points rate hike. In any case, the January meeting will bring more details regarding what the Fed might do in March.
As such, the US dollar should be supported on dips.
The problem comes from the economic slowdown. By March, the economic growth may weaken considerably, and so the Fed may be forced to hike while the economy cools.
FXOpen Blog