What's new

Forex News Daily Market Analysis By FXOpen

4.00 star(s) 11 Votes


EURNZD today as we see here, the price is in bullish trend, so it is good for you if you just follow the trend, you can open buy position when the price breaks resistance area 1.6346 with potential target up to 50 pips above
 
GBP/USD Struggle Continues, GBP/JPY Eyes More Gains


GBP/USD started another decline from well above the 1.2900 level. GBP/JPY is rising and might gain pace above the 164.20 resistance zone.

Important Takeaways for GBP/USD and GBP/JPY


  • The British Pound started a fresh decline after it failed near 1.2950 against the US Dollar.
  • Recently, there was a break above a key bearish trend line with resistance near 1.2500 on the hourly chart of GBP/USD.
  • GBP/JPY started a fresh increase after it formed a base above the 159.50 level.
  • There is a major bullish trend line forming with support near 163.25 on the hourly chart.

GBP/USD Technical Analysis

This past week, the British Pound started a major decline from the 1.3090 zone against the US Dollar. The GBP/USD pair broke the 1.3000 support zone to enter a bearish zone.

There was a clear move below the 1.2900 support and the 50 hourly simple moving average. It even traded below the 1.2750 and 1.2620 support levels. Finally, there was a move below the 1.2450 level and the pair traded as low as 1.2411 on FXOpen.

GBP/USD Hourly Chart


It is currently attempting an upside correction above 1.2500. There was a move above the 23.6% Fib retracement level of the key decline from the 1.3090 swing high to 1.2411 low.

There was also a break above a key bearish trend line with resistance near 1.2500 on the hourly chart of GBP/USD. However, the pair is facing a major resistance near the 1.3600 and 1.3620 levels. The next major hurdle is near the 1.2750 level.

The 50% Fib retracement level of the key decline from the 1.3090 swing high to 1.2411 low is also near the 1.2750 level. If there is no upside break above 1.2620, the pair could start a fresh decline.

An immediate support is near the 1.2525 level and the 50 hourly simple moving average. The next major support is near the 1.2500 level. If there is a break below the 1.2500 support, the pair could test the 1.2420 support.


Read Full on FXOpen Company Blog...
 
EUR/USD and EUR/JPY Could Extend Downsides


EUR/USD started a fresh decline from the 1.0750 resistance. EUR/JPY could extend downsides if there is a move below the 136.50 support.

Important Takeaways for EUR/USD and EUR/JPY


  • The Euro failed to clear the 1.0750 resistance and started a fresh decline.
  • There is a key bullish trend line forming with support near 1.0500 on the hourly chart.
  • EUR/JPY started a downside correction from the 138.00 resistance zone.
  • A major bearish trend line is forming with resistance near 137.20 on the hourly chart.

EUR/USD Technical Analysis

The Euro made a couple of attempts to clear the 1.0750 resistance zone against the US Dollar. However, the EUR/USD pair failed to gain strength above 1.0750 and started a fresh decline.

The pair declined below the 1.0600 support and the 50 hourly simple moving average. The pair even moved below the 1.0550 support level. A low was formed near 1.0470 on FXOpen before the pair started a short-term upside correction.

EUR/USD Hourly Chart


There was a move above the 1.0520 resistance level. It corrected above the 23.6% Fib retracement level of the key drop from the 1.0758 high to 1.0470 low.

On the upside, the pair is facing resistance near the 1.0580 level. It is near the 38.2% Fib retracement level of the key drop from the 1.0758 high to 1.0470 low. The next major resistance is near the 1.0620 level.

A clear break above the 1.0620 resistance could push EUR/USD towards 1.0700. If the bulls remain in action, the pair could revisit the 1.0750 resistance zone in the near term.

On the downside, the pair might find support near the 1.0500 level. There is also a key bullish trend line forming with support near 1.0500 on the hourly chart. If there is a downside break below the 1.0500 support, the pair might accelerate lower. The next major support sits near the 1.0470 level, below which there is a risk of a larger decline.


Read Full on FXOpen Company Blog...
 
ETHUSD and LTCUSD Technical Analysis – 05th MAY, 2022


ETHUSD: Bullish Engulfing Pattern above $2,750

Ethereum was moving in a bearish phase last week and touched a low of 2,725 on May 1st, after which it entered into a consolidation channel above the $2,750 handle.

This week, ETHUSD started moving in a bullish channel, and managed to cross the $2,900 handle in the European trading session today.

We can clearly see a bullish engulfing pattern above $2,750 which signifies the end of a bearish trend and the start of a bullish trend.

We can see that the price of Ethereum has retracted from its highs due to some profit taking, but the bullish channel continues, and we are aiming for the upsides of $3,100 and $3,300 this week.

ETH is now trading just below its pivot level of 2,936 and moving in a mild bullish momentum. The price of ETHUSD is now facing its classic resistance level of 2,944, Fibonacci resistance level of 2,960, and is now aiming towards the $3,000 handle in the US trading session.

Most of the moving averages are giving a BUY signal.

ETH is now trading below both its 100 hourly and 200 hourly simple MAs.

  • Ethereum is in a mildly bullish channel
  • Short-term trend reversal seen above $2,750
  • All the major technical indicators are giving a NEUTRAL to BUY signal
  • The average true range is indicating LESSER market volatility


Ether: Bullish Channel Above $2900 Confirmed


ETHUSD has consolidated its gains above $2,900 in the European trading session, and we can clearly see that the bullish channel is back.

We are now aiming for the upsides of $3,000 to $3,100 in today’s US trading session. The retracement from $2,721 was very strong which suggests that there is more room for the upsides in Ethereum this month, and a level of $3,500 is the next target.

We can see the MA crossover pattern above the level of 2,850 which means that in the immediate short term we will see the continuation of the bullish channel.

ETH has gained 2.86% with a price change of 81.25$ in the past 24hrs, and has a trading volume of 17.890 billion USD.

We can see an increase of 36% in the trading volume as compared to yesterday which means that new buyers are entering the markets and waiting for further correction in the levels of Ethereum.

The Week Ahead

Ether is printing above $2,980 today, and we can see levels of $3,000 to $3,200 this week.

The medium-to-long term outlook for Ether remains bullish with targets of above 3,500 in May.

With the US Federal Reserve increasing its benchmark interest rate by half a percentage point, the price of Ethereum continues rising along with other top cryptocurrencies.

Ether has already broken its major resistance level of $2,800 and is now facing the next resistance level of $3,000.

Technical Indicators:

The commodity channel index (14-day): at 135.24 indicating a BUY

The moving averages convergence divergence (14-day): at 14.80 indicating a BUY

The ultimate oscillator: at 61.44 indicating a BUY

The rate of price change: at 3.39 indicating a BUY


Read Full on FXOpen Company Blog...
 
AUD/USD and NZD/USD Might Struggle To Recover Losses


AUD/USD gained bearish momentum below the 0.7150 support zone. NZD/USD started a major decline after it faced sellers near 0.6565.

Important Takeaways for AUD/USD and NZD/USD


  • The Aussie Dollar started a fresh decline after it struggled near 0.7265 against the US Dollar.
  • There was a break below a major bullish trend line with support near 0.7160 on the hourly chart of AUD/USD.
  • NZD/USD also started a major decline after it failed to stay above 0.6550.
  • There was a move below a key bullish trend line with support near 0.6445 on the hourly chart of NZD/USD.

AUD/USD Technical Analysis

The Aussie Dollar faced a strong selling interest near the 0.7265 level against the US Dollar. The AUD/USD pair started a major decline below the 0.7200 level.

There was a clear move below the 0.7160 and 0.7150 support levels. Besides, there was a break below a major bullish trend line with support near 0.7160 on the hourly chart of AUD/USD. The pair declined below the 50% Fib retracement level of the upward move from the 0.7030 swing low to 0.7265 high (formed on FXOpen).

AUD/USD Hourly Chart


The pair even declined below the 0.7120 support level and the 50 hourly simple moving average. Finally, it tested the 76.4% Fib retracement level of the upward move from the 0.7030 swing low to 0.7265 high.

On the upside, the AUD/USD pair is facing resistance near the 0.7120 level. The next major resistance is near the 0.7150 level. A close above the 0.7150 level and the 50 hourly simple moving average could start a steady increase in the near term.

The next major resistance could be 0.7200. On the downside, an initial support is near the 0.7085 level. The next support could be the 0.7050 level.

If there is a downside break below the 0.7050 support, the pair could extend its decline towards the 0.7000 level. Any more downsides might send the pair toward the 0.6920 level.


Read Full on FXOpen Company Blog...
 
GBP/USD and EUR/GBP: British Pound Remains In Downtrend


GBP/USD started a fresh decline from well above the 1.2650 level. EUR/GBP is rising and might attempt an upside break above the 0.8600 resistance zone.

Important Takeaways for GBP/USD and EUR/GBP


  • The British Pound started a fresh decline from well above 1.2650 against the US Dollar.
  • There is a key bearish trend line forming with resistance near 1.2335 on the hourly chart of GBP/USD.
  • EUR/GBP formed a base above 0.8350 and started a fresh increase.
  • There is a major bullish trend line forming with support near 0.8535 on the hourly chart.

GBP/USD Technical Analysis

The British Pound struggled to settle above the 1.2620 resistance zone against the US Dollar. The GBP/USD pair started a fresh decline below the 1.2550 support zone.

There was a clear move below the 1.2500 level and the 50 hourly simple moving average. The bears pushed the pair below the 1.2400 level and a new multi-week low was formed near 1.2278 on FXOpen.

GBP/USD Hourly Chart


The pair is now consolidating losses above the 1.2280 level. On the upside, an initial resistance is near the 1.2335 level. There is also a key bearish trend line forming with resistance near 1.2335 on the hourly chart of GBP/USD.

The next main resistance is near the 1.2400 zone and the 50 hourly simple moving average. It is close to the 23.6% Fib retracement level of the key decline from the 1.2637 swing high to 1.2278 low.

The main resistance is now forming near the 1.2450 level. It is close to the 50% Fib retracement level of the key decline from the 1.2637 swing high to 1.2278 low. A clear upside break above the 1.2450 and 1.2460 resistance levels could open the doors for a steady increase in the near term.

If not, the pair might continue to move down below 1.2280. The next major support is near the 1.2220 level. Any more losses could lead the pair towards the 1.2150 support zone or even 1.2120.


Read Full on FXOpen Company Blog...
 
BTCUSD and XRPUSD Technical Analysis – 10th MAY 2022


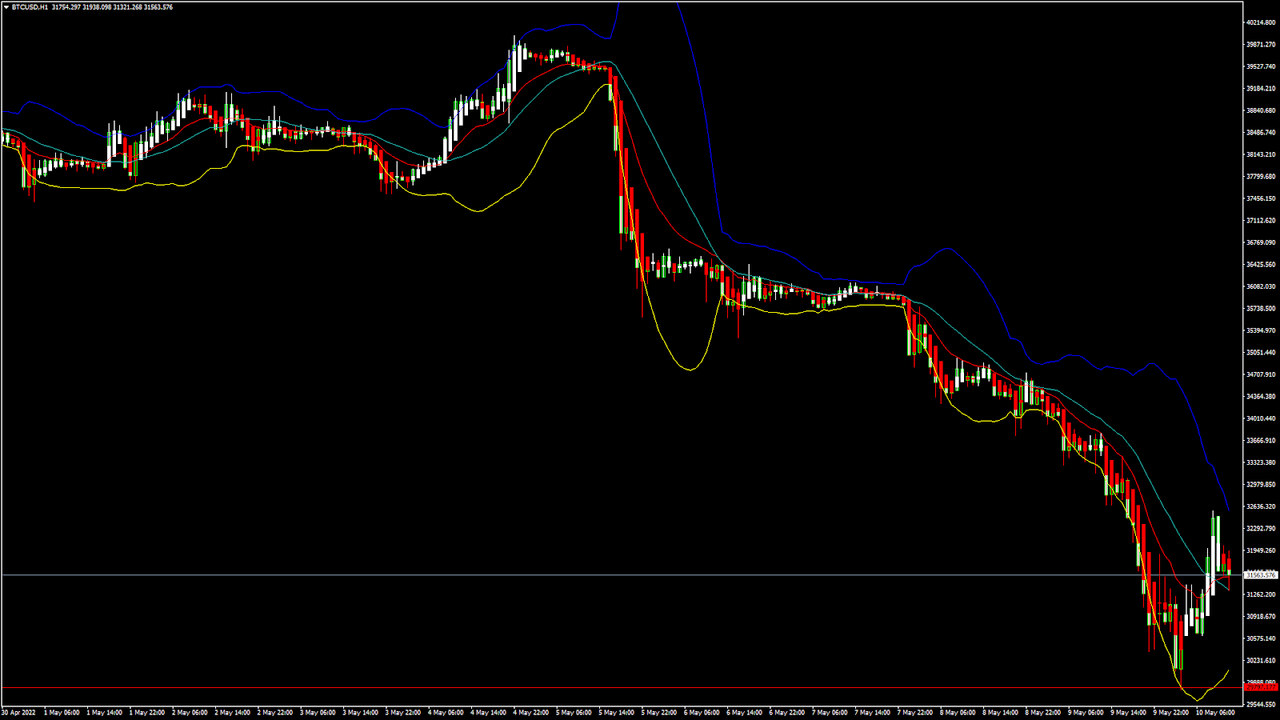
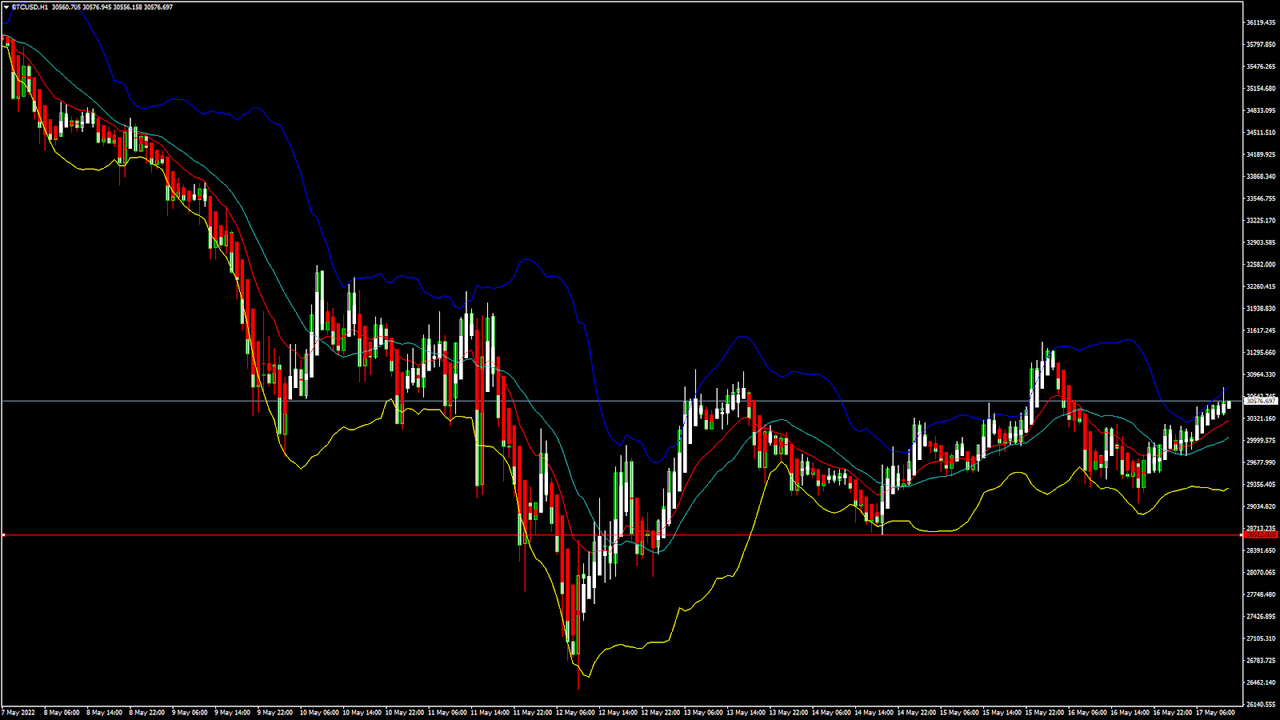
BTCUSD: Rounding Bottom Pattern Above $29,700

Bitcoin was not able to sustain its bullish momentum last week, and after touching a high of $40,000 on May 4th, started to decline heavily against the US dollar.

The short-selling continued pushing the price of BTC below the $30,000 handle, after which we can observe some consolidation.

We can see a pullback in the market at levels above $30,000, which is expected to continue towards $35,000.

We can clearly see a rounding bottom pattern above the $29,700 handle — which is a bullish reversal pattern signifying the end of a downtrend and a shift towards an uptrend.

The Stoch and Williams percent range are indicating an overbought level which means that in the immediate short term, a decline in the prices is expected.

The relative strength index is at 44 indicating a WEAK demand for bitcoin at the current market level.

Bitcoin is now moving below its 100 hourly simple and 200 hourly exponential MAs.

Some of the major technical indicators are giving a BUYsSignal, which means that in the immediate short term, we are expecting targets of $32,000 and $34,000.

The average true range is indicating LESSER market volatility with a mildly bullish momentum.

  • Bitcoin: bullish reversal seen above $29,700
  • The StochRSI is indicating an OVERBOUGHT level
  • The price is now trading just below its pivot level of $31,810
  • Some of the moving averages are giving a BUY market signal

Bitcoin: Bullish Reversal Seen Above $29,700


Bitcoin has moved out of the falling trend seen last week and now continues to consolidate its gains above the $30,000 handle in the European trading session. The bounce that we have seen above $30,000 is expected to continue this week, and we are now looking at targets of $32,000 and $35,000 in the medium-term range.

The immediate short-term outlook for bitcoin is mildly bullish; the medium-term outlook has turned neutral; the long-term outlook remains neutral under present market conditions.

We are now looking at possible reversal and short selling at 32,946 and 34,350 as indicated by the MA50 and MA100 crossover patterns. This is further validated by an overbought level seen in the Stoch and Williams percent range.

The price of BTCUSD is now facing its classic resistance level of $32,009, Fibonacci resistance level of $32,240 after which the path towards $34,000 will get cleared.

In the last 24hrs, BTCUSD has declined by -5.59% with a price change of 1872$, and has a 24hr trading volume of USD 81.634 billion. We can see an increase of 111% in the trading volume as compared to yesterday, which is due to the heavy selling seen across global cryptocurrency markets.

The Week Ahead

The price of bitcoin touched an intraday low of $29,829 in the Asian trading session, and an intraday high of $32561 in today’s European trading session.

The daily RSI is printing at 30 which means that the medium range demand continues to be weak. This is also an opportunity for long-term investors to enter into the markets at lower levels.

The current market condition is suitable for entering into a BUY position with targets of $33,000 and $35,000 next week.

The price of BTCUSD will need to remain above the important support level of $30,000 this week.

The weekly outlook is projected at $33,000 with a consolidation zone of $32,500.
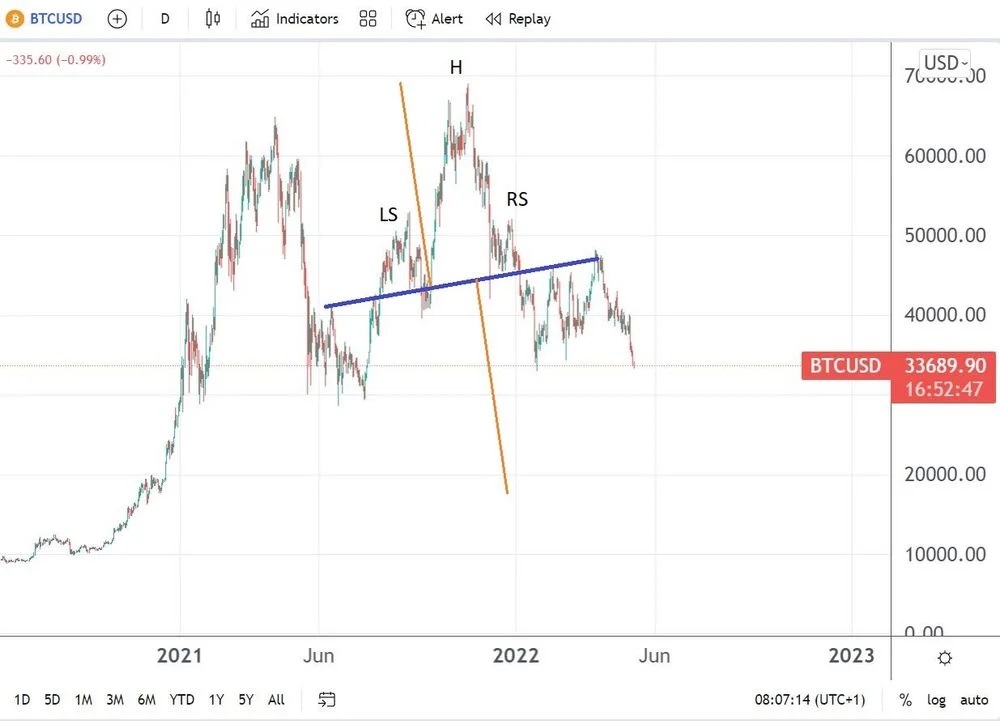
Bitcoin Down by 50%

The price of bitcoin touched an all-time high of $67,566 in November, 2021, and with the current market price of $31,570 marks a drop of 50% in its value.

The ongoing global economic crisis, rise in the interest rates, the Russia-Ukraine war and its effects on the global investor sentiments are driving bitcoin to historic lows, which has led to a decline in the total market capitalization of bitcoin to $600 billion USD.

Technical Indicators

The StochRSI (14-day): at 74.78 indicating a BUY

The average directional change(14-day): at 28.58 indicating a NEUTRAL level

The rate of price change: at 1.349 indicating a BUY

The moving averages 20: indicating a BUY


Read Full on FXOpen Company Blog...
 
EUR/USD Remains At Risk, USD/JPY Might Correct Gains


EUR/USD is attempting an upside correction and facing resistance near 1.0550. USD/JPY might correct lower if it trades below 130.00.

Important Takeaways for EUR/USD and USD/JPY

  • The Euro started an upside correction from the 1.0500 zone.
  • There is a key bearish trend line forming with resistance near 1.0560 on the hourly chart of EUR/USD.
  • USD/JPY extended rally above 130.00 and traded to a new multi-year high.
  • There is a major bullish trend line forming with support near 130.00 on the hourly chart.

EUR/USD Technical Analysis

This past week, the Euro started saw bearish moves below the 1.0650 level against the US Dollar. The EUR/USD pair declined heavily below the 1.0550 support zone.

The pair even broke the 1.0500 level and settled below the 50 hourly simple moving average. A low was formed near 1.0482 on FXOpen and the pair is now correcting higher. There was a move above the 1.0550 resistance level.

EUR/USD Hourly Chart


However, the pair failed to gain pace above the 1.0600 level. It is now moving lower and trading below 1.0550. There was a break below the 50% Fib retracement level of the recent increase from the 1.0495 swing low to 1.0592 high.

It is now consolidating near the 61.8% Fib retracement level of the recent increase from the 1.0495 swing low to 1.0592 high. An immediate resistance on the upside is near the 1.0542 level. The next major resistance is near the 1.0560 level.

There is also a key bearish trend line forming with resistance near 1.0560 on the hourly chart of EUR/USD. The main resistance is near the 1.0600 level. An upside break above 1.0600 could set the pace for a steady increase.

If not, the pair might drop and test the 1.0500 support. The next major support is near 1.0480, below which the pair could drop to 1.0420 in the near term.

Read Full on FXOpen Company Blog...
 
Cryptocurrencies Under Pressure as Bitcoin’s Slide Continues


Bitcoin is the most important cryptocurrency, and its price fluctuations influence the entire cryptocurrency market. When the price of bitcoin advances or declines, all other coins do the same.

In other words, the thousands of other coins literally depend on what bitcoin does.

So far this year, bitcoin has been under pressure: it opened the year around $50,000, and now threatens to drop through the $30,000 level. Only this time around, the decline in bitcoin’s price is more relevant than in the past. Nowadays, bitcoin has been adopted by market players other than retail traders.

For years, retail traders and believers in the cryptocurrency space have hoped that institutional investors would adopt bitcoin. They have, but with increased adoption came increased risks. For example, now that bitcoin is part of numerous portfolios, it acts like the general market does. As such, the dollar’s strength in 2022 is seen in the price of bitcoin too.


Head-and-Shoulders Pattern Points To $20,000

One of the most powerful reversal patterns is called “head-and-shoulders”. It is formed by two shoulders and one head, resembling the human body, and it has a measured move, calculated by measuring the distance from the highest point in the pattern to the neckline, and projecting it to the downside. This is the minimum distance that the market needs to travel in order to confirm the reversal.

In bitcoin’s case, the measured move points to a decline towards $20,000. Such a move alone is enough to put further pressure on bitcoin hodlers, but also on the financial system.

Last week, MicroStrategy, a US-based publicly listed company that had invested heavily in bitcoin, revealed that it would receive a margin call should the price of bitcoin drop to $21,000.

To buy its bitcoins, the company borrowed money, and now it needs to serve $2.5 billion in debt with $500 million in revenues. As such, a decline in the price of bitcoin is not a risk only for retail hodlers, but also for other financial market participants.

To sum up, the price of bitcoin remains bearish while trading below the head-and-shoulders’ neckline. With every day that passes, the pressure mounts, and retail hodlers may be forced to liquidate just as big players are too.

It would also be interesting to see what other big investors, such as Tesla, would do with their bitcoin holdings when the price declines below their buying price. A move below $30,000 would put pressure on Tesla, and when and if big investors flee, it might be the end of the cryptocurrency market as we know it.

FXOpen Blog
 
ETHUSD and LTCUSD Technical Analysis – 12th MAY, 2022


ETHUSD: Double Top Pattern Below $2,450

Ethereum was unable to sustain its bullish momentum last week, and after touching a high of 2,960 on May 4, started to decline heavily against the US dollar.

We can see the continuation of the bearish momentum this week, and the decline continues pulling down the prices of Ethereum below the 1,900 handle in the European trading session today.

The global investor sentiment is very weak, which is the cause of the massive slide in the cryptocurrency markets, including Ethereum.

After touching an intraday low of $1,780, we can see some pullback action and a move towards the consolidation channel above the $1,800 handle.

We can clearly see a double top pattern below the $2,450 handle, which is a bearish pattern; it signifies the end of a bullish phase and the start of a bearish phase in the markets.

ETH is now trading just below its pivot level of 1,908 and moving into a consolidation channel. The price of ETHUSD is now testing its classic support level of 1,820 and Fibonacci support level of 1,884, after which the path towards 1,800 will get cleared.

The relative strength index is at 35, indicating a WEAK demand for Ethereum and the continuation of the bearish trend.

The StochRSI is indicating a neutral level which means that the prices are due to remain into a consolidation phase in the short term.

All of the technical indicators are giving a STRONG SELL market signal.

All of the moving averages are giving a STRONG SELL signal, and we are now looking at the levels of $1,850 to $1,800 in the short-term range.

ETH is now trading Below both the 100 hourly and exponential MAs.

  • Ether: a bearish reversal is seen below the $2,450 mark
  • The short-term range appears to be mildly BEARISH
  • The daily RSI is below 50 at 24, indicating an OVERSOLD market
  • The average true range is indicating HIGH market volatility

Ether: Bearish Reversal Seen Below $2,450


ETHUSD is now moving in a mildly bearish channel with the prices trading below the $2,000 handle in the European trading session today.

We can see an MA5 crossover pattern located at 1,884, which means that a potential bullish reversal is possible after touching these levels.

ETHUSD is now facing its immediate support level of $1,861 and $1,841 after which we will see a linear progression towards the level of $1,800.

The key resistance levels to watch are $1,931 and $1,976, and the prices of ETHUSD need to cross these levels for a potential bullish reversal.

ETH has declined by 19.67% with a price change of 468.56$ in the past 24hrs and has a trading volume of 54.488 Billion USD.

We can see an Increase of 53.79% in the total trading volume in the last 24 hrs. which is due to the heavy selling by long-term investors.

The Week Ahead

The global economic factors and the increase in the interest rate announced by the Fed have made the US dollar stronger, which has led to a massive decline in the prices of Ethereum.

The delay in the implementation of the ETH 2.0 upgrade is also keeping the investors away from the markets.

The immediate short-term outlook for Ether has turned mildly BEARISH; the medium-term outlook has turned neutral; the long-term outlook for Ether is NEUTRAL in present market conditions.

This week, Ether is expected to move in a range between $1,800 and $2,000, and next week, Ether is expected to enter into a consolidation phase above the level of $2,000.

Technical Indicators:

The Stoch (9,6): at 22.35 indicating a SELL

The moving averages convergence divergence (12,26): at -104.87 indicating a SELL

The ultimate oscillator: at 40.75 indicating a SELL

The rate of price change: at -9.43 indicating a SELL


Read Full on FXOpen Company Blog...
 
Gold Price Faces Resistance While Oil Price Aims Higher


Gold price started a fresh decline from the $1,920 resistance. Crude oil price is rising and might gain pace above the $107 resistance.

Important Takeaways for Gold and Oil

  • Gold price started a fresh decline from well above the $1,900 zone against the US Dollar.
  • There is a key bearish trend line forming with resistance near $1,840 on the hourly chart of gold.
  • Crude oil price gained pace after it broke the $102 and $104 resistance levels.
  • There was a break above a major bearish trend line with resistance near $104.05 on the hourly chart of XTI/USD.

Gold Price Technical Analysis


Gold price struggled to gain pace for a move above the $1,920 resistance against the US Dollar. The price started a fresh decline below the $1,900 support zone.

There was a clear move below the $1,880 level and the 50 hourly simple moving average. The price even declined below the $1,850 support to move into a bearish zone. It traded as low as $1,810 on FXOpen and now correcting losses.

Gold Price Hourly Chart

There was a move above the $1,820 resistance. The price broke the 23.6% Fib retracement level of the downward move from the $1,858 swing high to $1,810 low.

On the upside, the price is facing resistance near the $1,835 level. It is near the 50% Fib retracement level of the downward move from the $1,858 swing high to $1,810 low. Besides, there is a key bearish trend line forming with resistance near $1,840 on the hourly chart of gold.

The main resistance is now forming near the $1,840 level. A close above the $1,840 level could open the doors for a steady increase towards $1,880. The next major resistance sits near the $1,900 level.

On the downside, an initial support is near the $1,820 level. The next major support is near the $1,810 level, below which there is a risk of a larger decline and the price might even struggle to stay above $1,800.

Read Full on FXOpen Company Blog...
 
GBP/USD Remains At Risk, USD/CAD Eyes More Gains


GBP/USD started a major decline below the 1.2300 support. USD/CAD is showing positive signs and gaining pace above the 1.2950 level.

Important Takeaways for GBP/USD and USD/CAD

  • The British Pound started a fresh decline from the 1.2400 resistance zone.
  • There was a break above a short-term bearish trend line with resistance near 1.2220 on the hourly chart of GBP/USD.
  • USD/CAD started a fresh increase from well below the 1.2650 zone.
  • There was a break above a key bearish trend line with resistance near 1.2965 on the hourly chart.

GBP/USD Technical Analysis

After struggling to clear the 1.2400 resistance zone, the British Pound found started a fresh decline against the US Dollar. GBP/USD traded below the 1.2300 support level to move into a bearish zone.

The bears gained strength for a move below the 1.2200 level and the 50 hourly simple moving average. The pair even spiked below the 1.2180 level and traded as low as 1.2155 on FXOpen. Recently, there was an upside correction above the 1.2200 level.

GBP/USD Hourly Chart


There was a break above a short-term bearish trend line with resistance near 1.2220 on the hourly chart of GBP/USD. The pair even spiked above the 50% Fib retracement level of the downward move from the 1.2399 swing high to 1.2155 low.

An immediate resistance is near the 1.2295 level. The next key resistance is near the 1.2305 level. It is near the 61.8% Fib retracement level of the downward move from the 1.2399 swing high to 1.2155 low.

If there is an upside break above the 1.2305 zone, the pair could rise towards 1.2400. The next key resistance could be 1.2450, above which the pair could gain strength.

On the downside, an initial support is near the 1.2220 area. The first major support is near the 1.2200 level. If there is a break below 1.2200, the pair could extend its decline. The next key support is near the 1.2150 level. Any more losses might call for a test of the 1.2040 support.

Read Full on FXOpen Company Blog...
 
Investors Keep Selling the JPY Despite Falling to the Lowest Since 2002 vs. the US Dollar


One of the big stories in the FX market in 2022 is the spectacular drop of the Japanese yen (JPY). Since March, it has depreciated against all its peers to reach the weakest levels vs. the US dollar since 2002.

Interestingly enough, the selloff comes when investors had all the reasons to buy the Japanese currency – not to sell it. Historically, the JPY acted as a safe-haven currency.

Effectively, it means that traders bought the JPY and sold US equities in times of uncertainty. Well, one did happen – US stocks are down by about -20% or more, depending on the sector. But the JPY did the opposite.


BOJ’s Measures Put Pressure on the Yen

The trigger of the yen’s weakness was the Bank of Japan’s policy. It continues to suppress bond yields, making JGBs or Japanese Government Bonds less attractive – and the yen too.

This is a central bank that diverges from other major central banks in the sense that it keeps easing conditions while others have started to tighten. The Federal Reserve of the United States is the perfect example, doing exactly the opposite of what the Bank of Japan is doing. Hence, the yen reached the weakest level in more than two decades against the US dollar.

But before blaming it all on the Bank of Japan, one thing should ring a bell for FX traders. If it was only the JPY declining the way it did, then the Bank of Japan was the sole reason for it.

Except it wasn’t.

The other safe-haven currency, the Swiss franc, dropped even more against the US dollar. The USD/CHF exchange rate rose above parity for the first time in many years as investors ran from the so-called safe-haven currencies and bought the US dollar – the world’s reserve currency.

So, what comes next?

Because of the Swiss franc is dropping in a similar or even more aggressive fashion, it means that the price action in the FX market is driven by the US dollar and the Fed and not by the Bank of Japan and the yen. Hence, look for the trend to continue as the move may have just started.

FXOpen Blog
 
US Consumers Spent Less Than Expected in December


The first two trading weeks of the new year are behind us, and investors have received and digested the last pieces of economic data for the just-concluded year. In the first trading week, the NFP (or non-farm payrolls) disappointed – the US economy added fewer jobs in December than the market expected.

The same can be said about the retail sales data for December released last Friday. Against the expectations of +0.2%, the core retail sales, the ones that exclude automobiles, fell by -2.3%.

In other words, the US consumer is cautious, and uncertainty is triggering a big pullback in spending. Inflation is eroding demand, and supply issues for goods remain persistent. Moreover, labor supply constraints and omicron fear are affecting consumer spending.

With only a week away ahead of the Fed’s January meeting, is the Fed going to hike into a slowing economy?


Fed signaled the start of a new tightening cycle

The monetary policy in the US is closely watched by the developed economies. It often acts as a benchmark for other central banks, which quickly follow in the Fed’s footsteps.

The Fed is currently engaged in tapering its asset purchases. Effectively, it means that it still eases the monetary policy, albeit at a slower pace, despite inflation running hot at four decades high.

As such, with interest rates at the lower boundary and inflation so high, many fear that the Fed is trapped. The tapering is supposed to end in March, and so the institution cannot raise the federal funds rate at its January meeting.

However, the January meeting is important as the forward guidance may change. So far, a 25 basis points rate hike is in the cards, but one should not be surprised if the Fed is more aggressive.

In order to regain credibility in the face of rising inflation, the Fed may decide to shock the market with a 50 basis points rate hike. In any case, the January meeting will bring more details regarding what the Fed might do in March.

As such, the US dollar should be supported on dips.

The problem comes from the economic slowdown. By March, the economic growth may weaken considerably, and so the Fed may be forced to hike while the economy cools.

FXOpen Blog
niceOk hand
 
BTCUSD and XRPUSD Technical Analysis – 17th MAY 2022


BTCUSD: Bullish Harami Pattern Above $28,600

Bitcoin was not able to sustain its bullish momentum last week, and after touching a high of $31,437 on 16th May, started to decline heavily against the US dollar.

The short selling continued pushing down the price of BTC below the $30,000 handle, touching a low of $29,169 after which we can see some consolidation.

We can see a pullback in the markets at a level above $30,000, which is expected to continue towards $33,000.

We can clearly see a bullish harami pattern above the $28,600 handle which is a bullish reversal pattern because it signifies the end of a downtrend and a shift towards an uptrend.

Both the Stoch and StochRSI are indicating an overbought level which means that in the immediate short term, a decline in the prices is expected.

The relative strength index is at 57 indicating a STRONG demand for bitcoin at the current market level.

Bitcoin is now moving above its 100 hourly simple and 200 hourly simple MAs.

Most of the major technical indicators are giving a STRONG BUY signal, which means that in the immediate short term, we are expecting targets of 32,000 and 33,500.

The average true range is indicating LESSER market volatility with a mildly bullish momentum.

  • Bitcoin: bullish reversal seen above $28,600
  • The Williams percent range is indicating an OVERBOUGHT level
  • The price is now trading just above its pivot level of $30,443
  • All of the moving averages are giving a STRONG BUY market signal

Bitcoin: Bullish Reversal Seen Above $28,600


Bitcoin continues to move into a consolidation channel above the $30,000 handle in the European trading session today.

The bounce that we have seen above the $30,000 handle is expected to continue this week, and we are now looking at the targets of $32,000 and $33,500 in the medium-term range.

The immediate short-term outlook for bitcoin is mildly bullish; the medium-term outlook has turned neutral; and the long-term outlook remains neutral under present market conditions.

Bitcoin continues to consolidate above its important support level of $30,000, and with increasing demand zone formation the immediate target is $31,500

The price of BTCUSD is now facing its classic resistance level of 30,533 and Fibonacci resistance level of 30,653, after which the path towards 32,000 will get cleared.

In the last 24hrs, BTCUSD has increased by 3.17% by 939$, and has a 24hr trading volume of USD 31.059 billion. We can see an increase of 1.58% in the trading volume as compared to yesterday, which appears to be normal.

The Week Ahead

The price of bitcoin is moving in a mildly bullish momentum, and the immediate targets are $31,000 and $31,500

The daily RSI is printing at 35 which means that the medium-range demand continues to be weak.

The current market condition is suitable for entering into a BUY position with targets of $32,000 and $33,500 next week.

The price of BTCUSD will need to remain above the important support level of $30,000 this week.

The weekly outlook is projected at $32,000 with a consolidation zone of $31,500.

Technical Indicators:

The moving averages convergence divergence (12,26): at 121.40 indicating a BUY

THe average directional change (14-day): at 43.83 indicating a BUY

The rate of price change: at 3.529 indicating a BUY

The ultimate oscillator: at 65.16 indicating a BUY


Read Full on FXOpen Company Blog...
 
EUR/USD Recovers Ground, USD/CHF Could Extend Losses


EUR/USD started a decent increase from the 1.0350 zone. USD/CHF is sliding and might extend losses below the 0.9900 support zone.

Important Takeaways for EUR/USD and USD/CHF

  • The Euro started a recovery wave from the 1.0350 support zone against the US Dollar.
  • There was a break above a major bearish trend line with resistance near 1.0515 on the hourly chart of EUR/USD.
  • USD/CHF topped near the 1.0060 zone and started a downside correction.
  • There was a break below a connecting bullish trend line with support near 1.0020 on the hourly chart.

EUR/USD Technical Analysis

The Euro formed a base above the 1.0350 zone and started a decent increase against the US Dollar. The EUR/USD pair climbed above the 1.0420 resistance zone to move into a bullish zone.

There was a steady increase above the 1.0500 resistance zone and the 50 hourly simple moving average. Besides, there was a break above a major bearish trend line with resistance near 1.0515 on the hourly chart of EUR/USD.

EUR/USD Hourly Chart


There was a clear move above the 50% Fib retracement level of the key decline from the 1.0592 swing high (formed on FXOpen) to 1.0350 low.

It is now consolidating near the 1.0550 level and the 61.8% Fib retracement level of the key decline from the 1.0592 swing high to 1.0350 low. On the upside, an initial resistance is near the 1.0550 level. The next major resistance is near the 1.0580 level.

A clear move above the 1.0580 resistance zone could set the pace for a larger increase towards 1.0650. The next major resistance is near the 1.0750 zone.

On the downside, an immediate support is near the 1.0500 level. The next major support is near the 1.0480 level. A downside break below the 1.0480 support could start another decline.

Read Full on FXOpen Company Blog...
 
ETHUSD and LTCUSD Technical Analysis – 19th MAY, 2022


ETHUSD: Double Top Pattern Below $2,121

Ethereum was unable to sustain its bullish momentum last week, and after touching a high of 2,151 on 16th May started to decline heavily against the US dollar.

We can see the continuation of the bearish momentum this week, and the decline continues pulling down the prices of Ethereum below the 2,000 handle in the European trading session today.

With the increase in the market liquidity many of the medium-term investors are selling their stakes amid the ongoing proposed Ethereum 2.0 network upgrade.

The prices touched an intraday low of $1,902 in the Asian trading session, and an intraday high of $1,971 in the European trading session today.

We can clearly see a double-top pattern below $2,121 which is a bearish pattern and signifies the end of a bullish phase and the start of a bearish phase in the markets.

ETH is now trading just below its pivot level of 1,954 and moving into a consolidation channel. The price of ETHUSD is now testing its classic support level of 1,917, and Fibonacci support level of 1,945 after which the path towards 1,800 will get cleared.

The relative strength index is at 43 indicating a WEAK demand for Ethereum and the continuation of the bearish trend.

The StochRSI is indicating an overbought level which means that the price is due to decline further in the short term.

Most of the technical indicators are giving a STRONG SELL market signal.

All of the moving averages are giving a STRONG SELL signal, and we are now looking at the levels of $1,900 to $1,800 in the short-term range.

ETH is now trading below its 100 hourly and exponential MAs.

  • Ether: a bearish reversal seen below the mark of $2,121
  • Short-term range appears to be mildly BEARISH
  • The daily RSI is below 50 at 32 indicating a bearish market
  • The average true range is indicating LESS market volatility

Ether: Bearish Reversal Seen Below $2,121


ETHUSD is now moving in a mildly bearish channel with the prices trading below the $2,000 handle in the European trading session today.

We can see an SMA10 crossover pattern located at 1,940, which means that a potential bullish reversal is possible after touching these levels.

We have detected a bearish harami crossover pattern in the M15 chart which further validates the ongoing trends in the markets.

The key resistance levels to watch are $1,966 and $1,990, and the prices of ETHUSD need to cross these levels for a potential bullish reversal.

ETH has declined by 4.41% with a price change of 89.48$ in the past 24hrs, and has a trading volume of 18.320 billion USD.

We can see an Increase of 5.27% in the total trading volume in the last 24 hrs which appears to be normal.

The Week Ahead

The ongoing correction in the prices of Ethereum is also because of the pending ETH 2.0 network upgrade which is delayed from its original schedule. Many of the Ethereum investors are willing to wait till the new upgrade is launched before investing their funds.

The immediate short-term outlook for Ether has turned mildly BEARISH; the medium-term outlook has turned neutral; and the long-term outlook for Ether is NEUTRAL in present market conditions.

This week, Ether is expected to move in a range between $1,800 and $2,000, and next week, it is expected to enter into a consolidation phase above the level of $2,000.

Technical Indicators:

The Williams percent range: at -55.74 indicating a SELL

The moving averages convergence divergence (12,26): at -20.99 indicating a SELL

The ultimate oscillator: at 47.46 indicating a SELL

The rate of price change: at -1.364 indicating a SELL

Read Full on FXOpen Company Blog...
 
AUD/USD and NZD/USD Might Regain Bullish Momentum


AUD/USD traded higher but faced sellers near 0.7075. NZD/USD is correcting gains and approaching a key support zone near the 0.6350 level.

Important Takeaways for AUD/USD and NZD/USD

  • The Aussie Dollar started a fresh increase from the 0.6850 support zone against the US Dollar.
  • There is a key bullish trend line forming with support near 0.7000 on the hourly chart of AUD/USD.
  • NZD/USD also started a decent increase after it cleared the 0.6300 resistance zone.
  • There was a move above a major contracting triangle with resistance near 0.6355 on the hourly chart of NZD/USD.

AUD/USD Technical Analysis

The Aussie Dollar formed a base above the 0.6850 level and started a fresh increase against the US Dollar. The AUD/USD pair gained pace for a move above the 0.6950 resistance zone.

There was a clear move above the 0.7000 resistance zone and the 50 hourly simple moving average. The pair traded as high as 0.7072 on FXOpen and is currently correcting gains. There was a move below the 0.7025 support zone.

AUD/USD Hourly Chart


The pair is now trading near the 50% Fib retracement level of the upward move from the 0.6949 swing low to 0.7072 high. On the downside, an initial support is near the 0.7000 level.

There is also a key bullish trend line forming with support near 0.7000 on the hourly chart of AUD/USD. The trend line is near the 61.8% Fib retracement level of the upward move from the 0.6949 swing low to 0.7072 high.

The next support could be the 0.6950 level. If there is a downside break below the 0.6950 support, the pair could extend its decline towards the 0.6900 level. Any more downsides might send the pair toward the 0.6850 level.

On the upside, the AUD/USD pair is facing resistance near the 0.7040 level. The next major resistance is near the 0.7075 level. A close above the 0.7075 level could start a steady increase in the near term. The next major resistance could be 0.7150.

Read Full on FXOpen Company Blog...
 
GBP/USD and GBP/JPY Could Rise Steadily

GBP/USD started a fresh increase above the 1.2400 resistance zone. GBP/JPY is consolidating and might rise steadily above the 160.50 resistance zone.

Important Takeaways for GBP/USD and GBP/JPY

  • The British Pound started a fresh increase above the 1.2420 resistance against the US Dollar.
  • There is a key bullish trend line forming with support near 1.2465 on the hourly chart of GBP/USD.
  • GBP/JPY is showing positive signs above the 158.50 and 159.00 support levels.
  • There is a major bullish trend line forming with support near 159.20 on the hourly chart.

GBP/USD Technical Analysis

This past week, the British Pound formed a base above the 1.2150 level against the US Dollar. The GBP/USD pair started a steady increase above the 1.2200 and 1.2320 resistance levels.

There was also a clear move above the 1.2450 resistance and the 50 hourly simple moving average. The recent price action was bullish, and the pair even climbed above the 1.236 Fib extension level of the downward move from the 1.2500 swing high to 1.2329 low (formed on FXOpen).

GBP/USD Hourly Chart


It is now consolidating above the 1.2500 level. On the upside, the pair is facing resistance near the 1.2550 level. The next major hurdle is near the 1.2600 level.

The 1.618 Fib extension level of the downward move from the 1.2500 swing high to 1.2329 low is also near the 1.2600 zone. An upside break above 1.2600 could set the pace for a move towards the 1.2720 resistance zone.

If there is no upside break above 1.2600, the pair could start a fresh decline. An immediate support is near the 1.2500. The next major support is near the 1.2450 level.

There is also a key bullish trend line forming with support near 1.2465 on the hourly chart of GBP/USD. If there is a break below the 1.2450 support, the pair could test the 1.2320 support.

Read Full on FXOpen Company Blog...
 
ECB Hints At Positive Rates, Sending EUR Higher


The euro started the trading week on a higher note after the ECB President, Christine Lagarde, said that the central bank is ready to raise the rates during the summer. In a blog posted on the ECB’s website, Lagarde said that the lift-off date is drawing closer, and it is important for the markets to know the policy normalization path ahead.

Euro needed nothing more to rally. The EUR/USD, as seen below, jumped over 100 pips or more than 1% on the news. Traders now expect that the ECB will raise the key interest rate twice in July and once in September, bringing the deposit facility rate to zero.


ECB Prepares for the Ending of Negative Rates

It is a milestone for the ECB. The central bank has kept the interest rate below zero for many years, but now it fears that a weaker currency might add to inflation.

It is calculated that the euro depreciation since March 2022 alone could add another 10bp on inflation this year and 20bp in the year to come. Hence, the ECB wanted to make sure that the markets know it is not tolerating inflation much higher than its price stability definition.

As a consequence, the euro rallied across the board. It gained against all its peers, not only against the US dollar.

But the EUR/USD is the exchange rate that matters. To be able to gain against the dollar at a time when the Fed is hiking the rates aggressively is something to take into account by traders.

Euro traded as high as 1.23 against the dollar only twelve months ago. The rapid depreciation to below 1.04 worried the ECB, as it fuels higher inflation.

As such, the news that the central bank plans the normalization of its policy should not come as a surprise, despite the war in Ukraine. ECB has the mandate to deal with price stability, and the only way to do so is to raise the rates to combat inflation.

All in all, today’s news confirms that the ECB joined the hawkish camp. The big question in the months ahead would be if the summer rate hikes are all the ECB is willing to do, or some more await after September?

FXOpen Blog
 

Create an account or login to comment

You must be a member in order to leave a comment

Create account

Create an account on our community. It's easy!

Log in

Already have an account? Log in here.

Similar threads

Users Who Are Viewing This Thread (Total: 1, Members: 0, Guests: 1)

Top
AdBlock Detected

We get it, advertisements are annoying!

Sure, ad-blocking software does a great job at blocking ads, but it also blocks useful features of our website. For the best site experience please disable your AdBlocker.

I've Disabled AdBlock    No Thanks