What's new

Forex News Daily Market Analysis By FXOpen

4.00 star(s) 11 Votes
BTCUSD and XRPUSD Technical Analysis – 28th FEB 2023


BTCUSD: Bullish Doji Star Pattern Above $22796

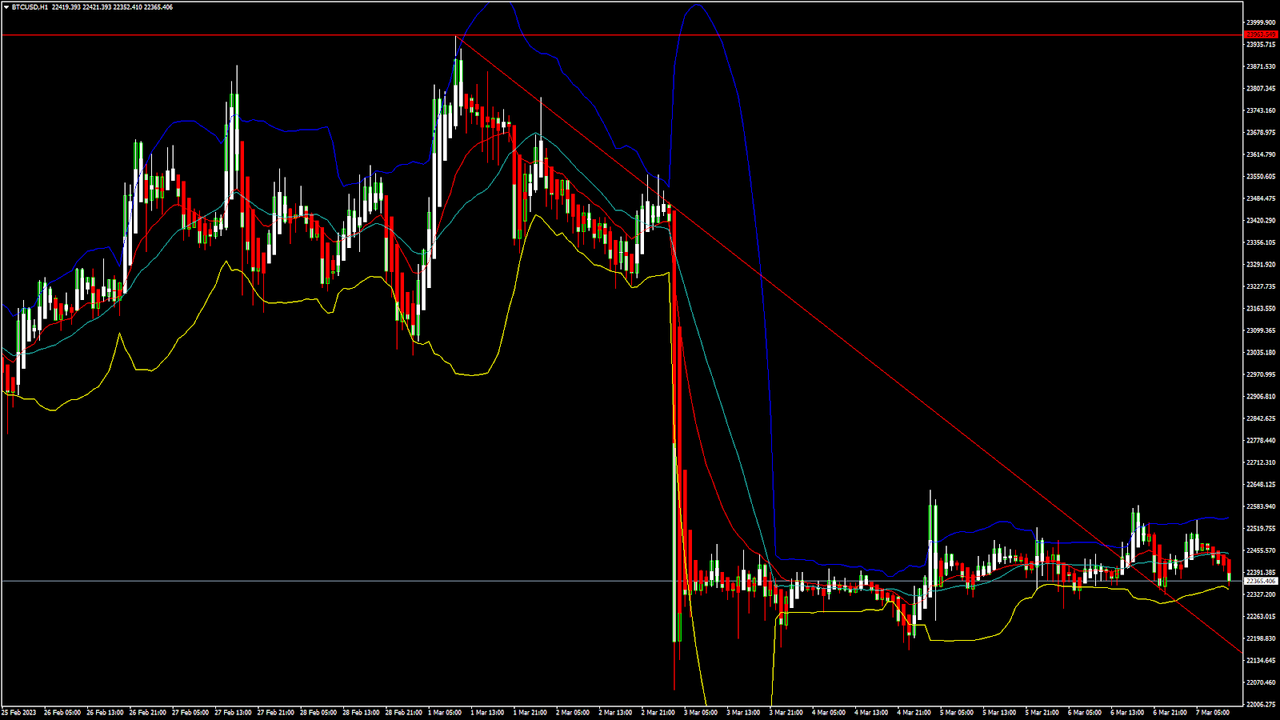
Bitcoin was unable to sustain its bearish momentum last week and after touching a low of $22796 on 25th Feb the prices started to correct upwards against the US dollar, touching a high of $23873 on 27th Feb.

We have seen a bearish opening of the markets this week.

We can clearly see a bullish Doji star pattern above the $22796 handle which is a bullish reversal pattern because it signifies the end of a downtrend and a shift towards an uptrend.

Bitcoin touched an intraday high of 23557 in the Asian trading session, and an intraday low of 23214 in the European trading session today.

We can see that the MACD indicator is back over zero in the weekly time frame indicating bullish trends.

The price of bitcoin is ranging near horizontal support in the weekly time frame indicating a bullish trend.

Both the STOCH and STOCHRSI are indicating Overbought levels which means that in the immediate short term, a decline in the prices is expected.

The price of bitcoin is ranging near the support of the channel in the 15-minute time frame indicating a bullish scenario.

The relative strength index is at 55.00 indicating a strong demand for bitcoin, and the continuation of the buying pressure in the markets.

Bitcoin is now moving below its 100 hourly simple moving average and below its 100 hourly exponential moving averages.

Most of the major technical indicators are giving a buy signal, which means that in the immediate short term, we are expecting targets of 24000 and 25500.

The average true range is indicating less market volatility with a bullish momentum.

  • Bitcoin: bullish reversal seen above $22796.
  • The Williams percent range is giving an overbought signal.
  • The price is now trading just below its pivot level of $23729.
  • The short-term range is mildly BULLISH.

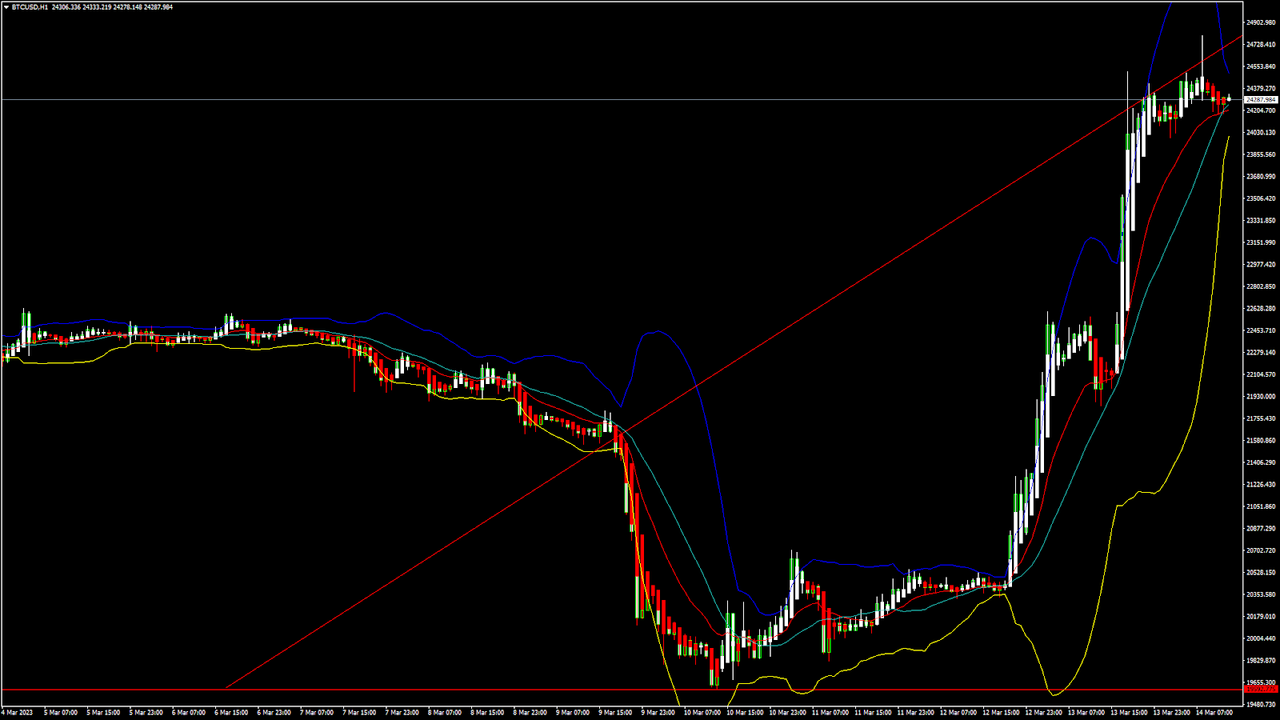
Bitcoin: Bullish Reversal Seen Above $22796


The price of bitcoin is now moving into a consolidation channel below the $23500 handle which also means that now we are preparing for the next upwards move in bitcoin towards the $25000 level.

The commodity channel index indicator is giving an oversold signal which indicates a neutral tone in the markets.

Some of the technical indicators are also giving a neutral tone present in the markets.

Bitcoin has resumed its rising trend channel with a positive momentum that is building at levels above the $23110.

The immediate short-term outlook for bitcoin is strongly bullish, the medium-term outlook has turned bullish, and the long-term outlook remains neutral under present market conditions.

Bitcoin’s support zone is located at $22711 which is a 14-day RSI at 50% and at $22893 which is a 3-10 day MACD oscillator stalls.

The price of BTCUSD is now facing its classic resistance level of 24948 and Fibonacci resistance level of 26119 after which the path towards 27000 will get cleared.

In the last 24hrs, BTCUSD has increased by 0.58% by 135.92$ and has a 24hr trading volume of USD 22.280 billion. We can see a decrease of 2.34% in the trading volume as compared to yesterday, which appears to be normal.

The Week Ahead

We can see that the price of bitcoin is now almost 53% up against the lows formed in November 2022.

The consolidation in the levels of bitcoin also indicates that the global investor sentiment continues to improve and will lead to the higher price of bitcoin in the month of March 2023.

The daily RSI is printing at 50.79 which indicates a neutral demand for bitcoin and the continuation of the bullish phase present in the markets in the short-term range.

We can see the formation of a bullish trend line from $22796 towards the $23989 level.

The price of BTCUSD is now facing its resistance zone located at $24030 at which the price crosses 9-day moving average and $24095 which is a 14-3 day raw stochastic at 70%

The weekly outlook is projected at $24500 with a consolidation zone of $24000.

VIEW FULL ANALYSIS VISIT - FXOpen Blog...

Disclaimer: This Forecast represents FXOpen Companies opinion only, it should not be construed as an offer, invitation or recommendation in respect to FXOpen Companies products and services or as Financial Advice.
 
EUR/USD Eyes Recovery While USD/JPY Remains In Uptrend


EUR/USD is correcting higher from the 1.0520 zone. USD/JPY is also rising and might rally further above the 137.00 resistance.

Important Takeaways for EUR/USD and USD/JPY

  • The Euro started an upside correction above the 1.0550 resistance zone.
  • There was a break above a key bearish trend line with resistance near 1.0570 on the hourly chart of EUR/USD.
  • USD/JPY is showing a lot of bullish signs above the 135.80 support zone.
  • There is a major bullish trend line forming with support near 135.80 on the hourly chart.

EUR/USD Technical Analysis

This past week, the Euro saw bearish moves below the 1.0600 support against the US Dollar. The EUR/USD pair even broke the 1.0580 support zone.

The pair gained pace below the 1.0550 support zone and traded as low as 1.0532 on FXOpen. The pair started an upside correction and traded above the 1.0550 resistance. There was a clear move above the 1.0580 level.

EUR/USD Hourly Chart


Besides, there was a break above a key bearish trend line with resistance near 1.0570 on the hourly chart of EUR/USD. A high was formed near 1.0645 and the pair started a fresh decline. There was a clear move below the 1.0600 support zone, but the pair stayed above the 50 hourly simple moving average.

There was a spike below the 61.8% Fib retracement level of the upward move from the 1.0532 swing low to 1.0645 high. It is now consolidating near the 1.0590 level.

On the upside, an immediate resistance is near the 1.0600 level. The next major resistance is near the 1.0640 level. An upside break above 1.0640 could set the pace for another increase. In the stated case, the pair might visit 1.0700.

Any more gains might send the pair towards 1.0750. If not, it could continue to move down. An initial support on the downside is near the 1.0570 level. The first major support is near the 1.0550 level.

The main support sits near the 1.0535 zone, below which the pair could start a major decline. In the stated case, the pair might dive towards the 1.0450 support zone.

VIEW FULL ANALYSIS VISIT - FXOpen Blog...

Disclaimer: This Forecast represents FXOpen Companies opinion only, it should not be construed as an offer, invitation or recommendation in respect to FXOpen Companies products and services or as Financial Advice.
 
ETHUSD and LTCUSD Technical Analysis – 02nd MAR, 2023


ETHUSD: Three White Soldiers Pattern Above $1558

Ethereum was unable to sustain its bearish momentum and after touching a low of $1558 on 25th Feb, the prices started to correct upwards against the US dollar ranging above the $1640 handle today in the Asian trading session.

The prices of Ethereum are ranging near a new record high of 1 month.

The price of ETHUSD is back over the pivot point in the weekly time frame indicating a bullish scenario.

We can clearly see a three white soldiers pattern above the $1558 handle which is a bullish pattern and signifies the end of a bearish phase and the start of a bullish phase in the markets.

ETH is now trading just above its pivot level of 1645 and moving into a mildly bullish channel. The price of ETHUSD is now testing its classic resistance level of 1650 and Fibonacci resistance level of 1656 after which the path towards 1700 will get cleared.

We can see the formation of the bullish harami pattern in the weekly timeframe.

The relative strength index is at 52.40 indicating a neutral demand for Ether and a shift towards the consolidation phase in the markets.

The commodity channel index, CCI, is giving a neutral signal, which means that the prices are expected to remain in a consolidation phase.

Some of the technical indicators are giving a buy market signal.

Most of the moving averages are giving a buy signal at the current market level of $1645.

ETH is now trading above both the 100 hourly simple and 100 hourly exponential moving averages.

  • Ether: bullish reversal seen above the $1558 mark.
  • The short-term range appears to be mildly bullish.
  • ETH continues to remain above the $1640 level.
  • The average true range is indicating less market volatility.

Ether: Bullish Reversal Seen Above $1558


ETHUSD continues to consolidate its gains and is now moving above the $1600 handle with an upside focus of $1700 and $1800 levels.

We can see the formation of the bullish trend reversal pattern with moving averages MA20 in the daily time frame.

The resistance of the channel is broken in the 15-minute time frame indicating a bullish outlook present in the markets.

ETHUSD touched an intraday high of 1677 in the Asian trading session and an intraday low of 1638 in the London trading session today.

The key support levels to watch are $1593 which is a 14-day RSI at 40%, and at $1637 at which the price crosses 18-day moving average stalls.

ETH has decreased by 0.73% with a price change of 12.10$ in the past 24hrs and has a trading volume of 6.909 billion USD.

We can see a decrease of 11.89% in the total trading volume in the last 24 hrs which is due to the market consolidation.

The Week Ahead

ETH has retracted after touching a high of $1677, and after this consolidation phase gets over, we are looking to cross the $1700 handle.

We can see the formation of a bullish ascending channel from $1558 towards the $1691 level.

The immediate short-term outlook for Ether has turned mildly bullish, the medium-term outlook has turned bullish, and the long-term outlook for Ether is neutral in present market conditions.

The resistance zone is located at $1686 which is a 14-3 day raw stochastic at 80% and at $1694 at which the price crosses 9-day moving average stalls.

The weekly outlook is projected at $1750 with a consolidation zone of $1700.

VIEW FULL ANALYSIS VISIT - FXOpen Blog...

Disclaimer: This Forecast represents FXOpen Companies opinion only, it should not be construed as an offer, invitation or recommendation in respect to FXOpen Companies products and services or as Financial Advice.
 
AUD/USD Aims Recovery While NZD/USD Remains In Uptrend


AUD/USD declined below the 0.6780 level before it found support near 0.6700. NZD/USD is rising and might aim a move above the 0.6250 resistance.

Important Takeaways for AUD/USD and NZD/USD

  • The Aussie Dollar started a fresh decline from the 0.6840 resistance against the US Dollar.
  • There is a key bearish trend line forming with resistance near 0.6755 on the hourly chart of AUD/USD.
  • NZD/USD started a decent increase above the 0.6150 resistance zone.
  • There is a major bullish trend line forming with support near 0.6220 on the hourly chart of NZD/USD.

AUD/USD Technical Analysis


The Aussie Dollar started a major decline from the 0.6840 resistance zone against the US Dollar. The AUD/USD pair declined below the 0.6800 and 0.6780 level.

The pair even moved below the 0.6750 level and the 50 hourly simple moving average. A low was formed near the 0.6706 on FXOpen and the pair is now recovering losses. The pair is now trading near the 0.6750 resistance zone and the 50 hourly simple moving average.

AUD/USD Hourly Chart


On the upside, the AUD/USD pair is facing resistance near the 0.6750 level. It is near the 50% Fib retracement level of the downward move from the 0.6783 swing high to 0.6706 low.

The next major resistance is near the 0.6755 level. There is also a key bearish trend line forming with resistance near 0.6755 on the hourly chart of AUD/USD. The trend line is near the 61.8% Fib retracement level of the downward move from the 0.6783 swing high to 0.6706 low.

A close above the 0.6755 level could start another steady increase in the near term. The next major resistance could be 0.6800.

On the downside, an initial support is near the 0.6725 level. The next support could be the 0.6700 level. If there is a downside break below the 0.6700 support, the pair could extend its decline towards the 0.6665 level.

VIEW FULL ANALYSIS VISIT - FXOpen Blog...

Disclaimer: This Forecast represents FXOpen Companies opinion only, it should not be construed as an offer, invitation or recommendation in respect to FXOpen Companies products and services or as Financial Advice.
 
Watch FXOpen's February 27 - March 3 Weekly Market Wrap Video

In this video, FXOpen UK COO Gary Thomson sums up the week’s happenings and discusses the most significant news reports.

  • US indices post worst week of 2023
  • SEC continues to put pressure on the crypto market
  • February removes the January positive
  • GBPUSD: Bearish pattern and CBR uncertainty

Watch our short and informative video, and stay updated with FXOpen.


FXOpen YouTube


Disclaimer: This forecast represents FXOpen Companies opinion only, it should not be construed as an offer, invitation or recommendation in respect to FXOpen Companies products and services or as financial advice.

#fxopen #fxopenyoutube #fxopenuk #weeklyvideo
 
GBP/USD Starts Recovery While USD/CAD Faces Key Resistance


GBP/USD is correcting losses and trading above the 1.2000 zone. USD/CAD is struggling to clear the 1.3650 resistance zone.

Important Takeaways for GBP/USD and USD/CAD

  • The British Pound started a decent recovery wave above the 1.2000 resistance zone.
  • There was a break above a key bearish trend line with resistance near 1.1965 on the hourly chart of GBP/USD.
  • USD/CAD is struggling below the 1.3640 and 1.3650 support levels.
  • There is a major bearish trend line forming with resistance near 1.3640 on the hourly chart.

GBP/USD Technical Analysis

The British Pound started a fresh decline from well above 1.2120 against the US Dollar. The GBP/USD pair gained bearish momentum after there was a break below the 1.2050 support.

The pair even broke the 1.2000 support level and the 50 hourly simple moving average. The recent swing high was formed near 1.1925 on FXOpen before the price started an upside correction. There was a move above the 1.1980 level.

GBP/USD Hourly Chart


There was a break above a key bearish trend line with resistance near 1.1965 on the hourly chart of GBP/USD. Besides, there was a move above the 50% Fib retracement level of the downward move from the 1.2142 swing high to 1.1925 low.

An immediate resistance is near the 1.2050 level. It is near the 61.8% Fib retracement level of the downward move from the 1.2142 swing high to 1.1925 low.

The next major resistance is near the 1.2080 level. Any more gains could lead the pair towards the 1.2120 barrier in the near term. If not, the pair could move down and might break the 1.2000 support. The next major support is near 1.1980.

If there is a downside break, GBP/USD might test the 1.1920 support. The next major support sits at 1.1850, where the bulls might take a stand.

VIEW FULL ANALYSIS VISIT - FXOpen Blog...

Disclaimer: This Forecast represents FXOpen Companies opinion only, it should not be construed as an offer, invitation or recommendation in respect to FXOpen Companies products and services or as Financial Advice.
 
Inflation top of the agenda as Euro slumps


The rampant inflation that has blighted the everyday lives of European citizens for over a year has now reached the high profile dialog of Christine Lagarde.

Ms. Lagarde, who is the President of the European Central Bank, has publicly stated that "inflation is a monster that we need to knock on the head”.

This may appear an obvious remark considering that consumers and businesses across Western Europe have been faced with inflation levels at around 10% to 11% for almost a year now, and in parts of Eastern Europe over 25% which has resulted in discernible levels of hardship for many citizens and businesses.

Perhaps the most concerning part of Ms. Lagarde’s direction on this matter is that she, along with many other central bankers across the Western world who are charged with the responsibility of managing inflation levels in the markets over which they preside, views interest rate increases as a solution.

This is a well-worn method of curtailing consumer spending and putting a stop to consumer borrowing, however it is also a generator of barriers to economic strength in that many members of the public can often become disenfranchised by being unable to afford to buy a house due to mortgage payment increases that are not in line with their earnings, and those who already have a mortgage feel the pinch as they have to find extra money to cover the increasing payments and spend less on other items.

Ms. Lagarde explained to press in Spain this week that the European Central Bank is not seeking to “break the economy” with rate increases as she appealed for banks to reschedule debt repayments for households struggling to cope with soaring borrowing costs on variable-rate mortgages.

That perhaps is one soundbite which attempts to try to soothe the fears of borrowers but ultimately the message remains that interest rates are increasing and have been for over a year now.

The Euro is now at almost parity with the US Dollar, this morning weighing in at 1.06, against a backdrop of US inflation having decreased from double figures last year to around 7% in recent weeks.

Of course, US inflation having decreased has its own disadvantages for US-based multinational businesses as they have to now pay more to supply and operate their European subsidiaries, however overall the domestic US economy appears to be settling down and the depreciation of the currency against everyday life expenses is nowhere near at European or British levels.

Certainly volatility is in the air for the Euro and likely the Pound too, as the British inflation level and monetary policy appears to resemble that of mainland Western Europe.

VIEW FULL ANALYSIS VISIT - FXOpen Blog...

Disclaimer: This Forecast represents FXOpen Companies opinion only, it should not be construed as an offer, invitation or recommendation in respect to FXOpen Companies products and services or as Financial Advice.
 
BTCUSD and XRPUSD Technical Analysis – 07th MAR 2023


BTCUSD: Evening Star Pattern Below $23963

Bitcoin was unable to sustain its bullish momentum last week and after touching a high of $23963 on 01st March, the prices started to correct downwards against the US dollar, touching a low of $22048 on 03rd March.

We have seen a bearish opening of the markets this week.

We can clearly see an evening star pattern below the $23963 handle which is a bearish reversal pattern because it signifies the end of an uptrend and a shift towards a downtrend.

Bitcoin touched an intraday high of 22544 in the Asian trading session, and an intraday low of 23370 in the European trading session today.

The momentum indicator is back under zero in the 4-hour time frame indicating bearish trends.

The price of bitcoin is ranging near a new record low of 1 month.

Both the STOCH and Williams percent range are indicating overbought levels which means that in the immediate short term, a decline in the prices is expected.

We can see the formation of bearish engulfing lines in the 1-hour time frame.

The relative strength index is at 43.75 indicating a weak demand for bitcoin, and the continuation of the selling pressure in the markets.

Bitcoin is now moving below its 100 hourly simple moving average and below its 100 hourly exponential moving averages.

Most of the major technical indicators are giving a sell signal, which means that in the immediate short term, we are expecting targets of 22000 and 21500.

The average true range is indicating less market volatility with a bearish momentum.

  • Bitcoin: bearish reversal seen below $23963.
  • The STOCHRSI is indicating an oversold market.
  • The price is now trading just below its pivot level of $22414.
  • The short-term range is mildly bearish.

Bitcoin: Bearish Reversal Seen Below $23963


The price of bitcoin is now moving in a consolidation channel above the $22000 handle after which fresh declines could be expected, or we can see some market correction upwards if the demand for bitcoin increases in the global markets.

Some of the technical indicators are also giving a neutral tone present in the markets.

We can see the formation of a bearish price crossover pattern with the adaptive moving average, AMA 50, in the 30-minute time frame.

The price of bitcoin is ranging near the resistance of the channel indicating a bearish trend present in the markets.

The immediate short-term outlook for bitcoin is strongly bearish, the medium-term outlook has turned bearish, and the long-term outlook remains neutral under present market conditions.

Bitcoin’s support zone is located at $21780 which is a 3-10 day MACD oscillator stalls, and at $21851 at which the price crosses 18-day moving average stalls.

The price of BTCUSD is now facing its classic support level of 22376 and Fibonacci support level of 22404 after which the path towards 22000 will get cleared.

In the last 24hrs, BTCUSD has increased by 0.03% by 5.75$ and has a 24hr trading volume of USD 15.799 billion. We can see an increase of 1208% in the trading volume compared to yesterday, which appears to be normal.

The Week Ahead

We can see that the price of Bitcoin has resumed its downtrend, which may extend to $21500 after which we may see some correction and change in the trend present in the markets.

There is a descending channel forming with the current support located at $20785 which is a 50% retracement from a 13-week high/low.

The daily RSI is printing at 43.26 which indicates a weak demand for bitcoin and the continuation of the bearish phase present in the markets in the short-term range.

We can see the formation of a bearish trendline from $23963 towards the $22141 level.

The price of BTCUSD is now facing its resistance zone located at $22695 which is a 14-3 day raw stochastic at 20% and at $22774 which is a 14-day RSI at 50%

The weekly outlook is projected at $21500 with a consolidation zone of $22000.

VIEW FULL ANALYSIS VISIT - FXOpen Blog...

Disclaimer: This Forecast represents FXOpen Companies opinion only, it should not be construed as an offer, invitation or recommendation in respect to FXOpen Companies products and services or as Financial Advice.
 
EUR/USD Gains Bearish Momentum While USD/CHF Extends Rally


EUR/USD started a major decline below the 1.0620 level. USD/CHF is rising and might aim more gains above the 0.9450 resistance.

Important Takeaways for EUR/USD and USD/CHF

  • The Euro started a fresh decline from the 1.0700 resistance against the US Dollar.
  • There was a break below a key bullish trend line with support near 1.0620 on the hourly chart of EUR/USD.
  • USD/CHF started a fresh increase above the 0.9350 resistance zone.
  • There was a break above a major bearish trend line with resistance near 0.9315 on the hourly chart.

EUR/USD Technical Analysis

After struggling to clear the 1.0700 resistance, the Euro started a fresh decline against the US Dollar. The EUR/USD pair traded below the 1.0620 support zone to enter a bearish zone.

The pair even declined below the 1.0600 level above the 50 hourly simple moving average. There was also a break below a key bullish trend line with support near 1.0620 on the hourly chart of EUR/USD. The decline gained pace below the 1.0580 level.

EUR/USD Hourly Chart


A low is formed near 1.0531 on FXOpen and the pair is now showing a lot of bearish signs. An immediate resistance is near the 1.0570 level. It is near the 23.6% Fib retracement level of the downward move from the 1.0694 swing high to 1.0531 low.

The next major resistance is near the 1.0610 level. It is near the 50% Fib retracement level of the downward move from the 1.0694 swing high to 1.0531 low.

A clear move above the 1.0610 resistance zone could send the pair further higher. Any more gains might open the doors for a move towards the 1.0650 level. If there is no recovery, the pair might continue to move down below the 1.0530 level.

On the downside, an immediate support is near the 1.0520 level. The next major support is near the 1.0500 level. A downside break below the 1.0500 support could start steady decline towards the 1.0450 level.

VIEW FULL ANALYSIS VISIT - FXOpen Blog...

Disclaimer: This Forecast represents FXOpen Companies opinion only, it should not be construed as an offer, invitation or recommendation in respect to FXOpen Companies products and services or as Financial Advice.
 
Euro hits one-month low against the US Dollar


It could be fair to say that the US Dollar, and the wider economy across the United States is an anomaly and has been for over a year.

Despite the same lockdowns in many major centers as other Western economies, the same supply chain difficulties disabling all sectors of industry to the same extent as that of Western Europe, and a similar approach toward involvement in geopolitical matters between the West and Russia, the American economy is not in anything like the bad condition experienced in other regions.

To compound this oddity further, the US Dollar has retained a very strong position against all other major currencies throughout the entirety of last year.

Yesterday, the US Dollar has shown its strength again, as the Euro has fallen to a one-month low against the greenback, with the rate now being at the low end of the 1.05 range during the early hours of the European trading session.

Some data released on Tuesday has put a dampener on the value of the Euro, one such metric being that retail sales within the Euro-denominated area, a good proxy for consumer demand, rebounded much less than expected in January, challenging other data, including PMI surveys, which pointed to a steady recovery.

Energy prices are continuing to soar across Europe, contributing massively to the overall increases in cost of living, which in some areas of Eastern Europe is compounded by inflation rates at over 25%, meaning that spending is outstripping earnings on a continual basis.

In Western Europe, the 10% average inflation is still a major barrier to economic stability and growth, whilst in the United States, the levels of inflation have been reducing over the past 6 months and are now at around 6%.

Manufacturing and productivity in the United States remained at least partially open during 2020 and 2021 with the states of Florida and Texas not conducting lockdowns. These are both heavily industrialised states and aside from their existing high technology, medical products, agricultural, energy production and scientific research sectors, attracted many other businesses from across the United States which relocated their offices to these states during 2021 and 2022.

This could be a contributor to the strength of the US dollar by comparison to the Euro, as the entire Eurozone limped in and out of lockdowns for almost 2 years and now the piper has to be paid.

Retail sales rose 0.3% on the month, below the 1% rise forecast by economists, and were down 2.3% year on year, demonstrating that this stagnation is continuing, and with more interest rate rises on the horizon, the belt is tight.

VIEW FULL ANALYSIS VISIT - FXOpen Blog...

Disclaimer: This Forecast represents FXOpen Companies opinion only, it should not be construed as an offer, invitation or recommendation in respect to FXOpen Companies products and services or as Financial Advice.
 
ETHUSD and LTCUSD Technical Analysis – 09th MAR, 2023


ETHUSD: Bearish Engulfing Pattern Below $1677

Ethereum was unable to sustain its bullish momentum and after touching a high of $1677 on 02nd Mar, the price started to decline against the US dollar trading below the $1550 handle today in the European trading session.

We have seen a bearish opening of the markets this week.

The price of ETHUSD is ranging near a new record low of 1 month.

We can clearly see a bearish engulfing pattern below the $1677 handle which is a bearish pattern and signifies the end of a bullish phase and the start of a bearish phase in the markets.

ETH is now trading just below its pivot levels of 1537 and moving in a mildly bearish channel. The price of ETHUSD is now testing its classic support level of 1530 and Fibonacci support level of 1536 after which the path towards 1500 will get cleared.

We can see the formation of a black hanging man in the 4-hour time frame indicating a neutral tone of the markets.

The relative strength index is at 40.95 indicating a weak demand for Ether and a shift towards the consolidation phase in the markets.

The commodity channel index, CCI, is giving an oversold signal, which means that the price is expected to correct upwards in the short-term range.

Most of the technical indicators are giving a sell market signal.

Most of the moving averages are giving a sell signal at the current market level of $1531.

ETH is now trading below both its 100 hourly simple and 100 hourly exponential moving averages.

  • Ether: bearish reversal seen below the $1677 mark.
  • The short-term range appears to be mildly bearish.
  • ETH continues to remain below the $1550 level.
  • The average true range is indicating less market volatility.

Ether: Bearish Reversal Seen Below $1677


ETHUSD continues to weaken and we can see a move towards the consolidation phase in the markets. Now the next visible targets are located at $1500 and $1450.

We can see the formation of the three black crows pattern in the 2-hour time frame indicating bearish trends.

The MACD crosses down its moving average in the 30-minute time frame indicating the bearish nature of the market.

ETHUSD touched an intraday high of 1552 in the Asian trading session and an intraday low of 1528 in the London trading session today.

The key support levels to watch are $1446 which is a 50% retracement from a 13 week high/low, and $1486 at which the price crosses 18-day moving average stalls.

ETH has decreased by 1.27% with a price change of 19.71$ in the past 24hrs and has a trading volume of 7.237 billion USD.

We can see a decrease of 0.87% in the total trading volume in the last 24 hrs which appears to be normal.

The Week Ahead

ETH was unable to cross the $1700 handle last week and now we are about to touch the $1500 level. If the demand for Ethereum increases we could witness a bounce in the levels next week.

We can see the formation of a bearish ascending channel from $1677 towards the $1522 level.

The immediate short-term outlook for Ether has turned mildly bearish, the medium-term outlook has turned bearish, and the long-term outlook for Ether is neutral in present market conditions.

The resistance zone is located at $1575 which is a 14-3 day raw stochastic at 20% and at $1586 which is a 14-day RSI at 50%.

The weekly outlook is projected at $1450 with a consolidation zone of $1500.

VIEW FULL ANALYSIS VISIT - FXOpen Blog...

Disclaimer: This Forecast represents FXOpen Companies opinion only, it should not be construed as an offer, invitation or recommendation in respect to FXOpen Companies products and services or as Financial Advice.
 
Watch FXOpen's March 6 - 10 Weekly Market Wrap Video

In this video, FXOpen UK COO Gary Thomson sums up the week’s happenings and discusses the most significant news reports.

  • Swiss National Bank reports record losses
  • AAPL shares: Goldman Sachs puts Buy rating
  • Inflation top of the agenda as Euro slumps
  • Powell accelerates the bullish trend on the dollar index

Watch our short and informative video and stay updated with FXOpen.


FXOpen YouTube


Disclaimer: This forecast represents FXOpen Companies opinion only, it should not be construed as an offer, invitation or recommendation in respect to FXOpen Companies products and services or as financial advice.

#fxopen #fxopenyoutube #fxopenuk #weeklyvideo
 
NASDAQ feels the effect of Silicon Valley Bank collapse


It was inevitable that a large, previously highly capitalised bank which is one of the preferred depositories of capital for venture capital-funded technology companies in the Silicon Valley and San Francisco Bay area, would create major waves within the wider financial markets economy if it collapsed.

Well, collapse it has, and the fallout is immense.

Silicon Valley Bank, which was founded 39 years ago at the height of the global technology revolution, has gone under, with losses estimated at over $15 billion, and now the fingers of blame are being pointed as the bank's collapse serves to echo the banking crisis of 2008/2009 after which many observers and government regulators cited lack of prudent governance, carefree risk management and lending to those who cannot afford repayments to have been factors.

So grave was it, that the US and European governments embarked on a whole new set of regulations in order to prevent financial institutions from engaging in gung-ho corporate policy and in favour of protecting the public and business community from being subjected to losses should banks fail.

However, here we are in 2023 and we are witnessing the second largest collapse of a bank in the history of the United States economy.

Once again, factors contributing to the collapse of Silicon Valley Bank include poor risk management and a bank run driven by tech industry investors.

The failure of SVB was the largest of any bank since the 2007–2008 financial crisis by assets, and the second largest in U.S. history behind that of Washington Mutual which went bankrupt in 2008.

Many high tech firms which had raised venture capital to fund their growth had deposited the venture capital in large sums into accounts at Silicon Valley Bank, and the bank had experienced such an influx of funds in the first part of this decade that it was unable to lend responsibly so took on government bonds, which were long term in their investment structure, and had done so during a period of low interest rates.

Now the piper has to be paid, and the liabilities were too high.

As a result, shareholder confidence in publicly listed stocks on the tech-friendly NASDAQ exchange have taken a downturn.

At close of business on Friday, the NASDAQ Composite index had declined by over 5% during the course of last week, with losses gaining ground after the announcement of the collapse of Silicon Valley Bank.

This high profile and scandalous collapse of a major financial institution which has many Silicon Valley tech firms as customers has added a new dent to the performance of US tech stocks, which have been volatile for some time now.

Over the course of 2022, US tech stocks were very low compared to the previous year, and older style, traditional companies were doing well, and still are – such as those listed on London’s FTSE 100 index.

Overall, the venture-capital funded tech scene is seen as avantgarde but risky compared to the old money which exists on traditional exchanges.

It is just that now, we are seeing the market treat it as such.

VIEW FULL ANALYSIS VISIT - FXOpen Blog...

Disclaimer: This Forecast represents FXOpen Companies opinion only, it should not be construed as an offer, invitation or recommendation in respect to FXOpen Companies products and services or as Financial Advice.
 
Turkish Lira crisis lingers with sustained record low against USD


The Turkish economy is a highly diversified one.

Its industry base is by far the most developed in the Middle East, almost resembling European nations with its highly advanced telecommunications, tourism, vehicle manufacturing, computer science, fintech, clothing and consumer white goods sectors.

It’s an industrious society and has been improving tremendously over the years in its modernity.

The main obstacle faced by Turkish businesses and households in recent times has been directly connected to the country’s clearly diversified but somehow troubled economy.

Over the past two days, the Turkish Lira has plummeted even further to the extent that it is now at an all-time low against the US Dollar and other major currencies.

Today, the Turkish Lira is trading at 18.97 against the US Dollar, a value far lower than any time in history.

Presidential and parliamentary elections scheduled for May 14 are adding to uncertainty, although they are still some two months away. Overall, there is a concern over the possible continuation of current President Tayyip Erdogan's controversial policies which have led to a rapidly depreciating currency and an eye-watering 70% inflation figure, or if monetary policy could perhaps revert to orthodoxy as promised by the opposition should the opposition become elected.

Added to the long-existing fiscal malaise in Turkey, global economists are now looking at the economic impact of the disastrous earthquakes that hit Turkey last month.

The depreciation to new record lows has occurred despite the recent deposit of $5 billion into the Turkish central bank by the Saudi Fund for Development, which was cited at the time to be "a demonstration of the Kingdom of Saudi Arabia’s commitment to supporting Turkey’s efforts to strengthen its economy’.

Rather astonishingly, The Turkish Lira has depreciated over the past five years against the British Pound by a staggering 300%, demonstrating that its instability has dented the Turkish economy, but has encouraged British tourists to visit the country even more than they already do - and Turkey is one of the most popular vacation destinations for British tourists.

Also, on the subject of tourism, Turkey has welcomed tens of thousands of tourists from Russia over the past year, as its neutrality has been a boon for business.

Whilst it is good that the tourist industry is booming, the depreciation of revenues from tourist business remains a hard metric to swallow in that 70% inflation has done a lot to wipe out a large proportion of revenue.

Turkey's workforce continues to be industrious and is not showing signs of giving up, so it is an economic region to watch closely.

VIEW FULL ANALYSIS VISIT - FXOpen Blog...

Disclaimer: This Forecast represents FXOpen Companies opinion only, it should not be construed as an offer, invitation or recommendation in respect to FXOpen Companies products and services or as Financial Advice.
 
BTCUSD and XRPUSD Technical Analysis – 14th MAR 2023


BTCUSD: Bullish Engulfing Pattern Above $19552

Bitcoin was unable to sustain its bearish momentum last week and after touching a low of $19552 on 10th March, the prices started to correct upwards against the US dollar, touching a high of $24800 today in the European trading session.

We have seen a bullish opening of the markets this week.

We can clearly see a bullish engulfing pattern above the $19552 handle which is a bullish reversal pattern because it signifies the end of a downtrend and a shift towards an uptrend.

Bitcoin touched an intraday high of 24800 in the European trading session, and an intraday low of 24005 in the Asian trading session today.

We can see the formation of bullish engulfing lines in the weekly time frame.

The price of bitcoin is ranging near a new record high of 1 month.

Both the STOCH and Williams percent range are indicating overbought levels which means that in the immediate short term, a decline in the prices is expected.

The MACD indicator is giving a bullish divergence signal in the weekly time frame.

The relative strength index is at 68.46 indicating a STRONG demand for bitcoin, and the continuation of the buying pressure in the markets.

Bitcoin is now moving above its 100 hourly simple moving average and above its 100 hourly exponential moving averages.

Most of the major technical indicators are giving a buy signal, which means that in the immediate short term we are expecting targets of 24500 and 25000.

The average true range is indicating less market volatility with a bullish momentum.

  • Bitcoin: bullish reversal seen above $19552.
  • The STOCHRSI is indicating an oversold market.
  • The price is now trading just below its pivot level of $24298.
  • The short-term range is strongly BULLISH.

Bitcoin: Bullish Reversal Seen Above $19552


The price of bitcoin is now moving in a strongly bullish momentum above the $24000 handle. After some market consolidation, we can see fresh upsides in the ranges of $24500 to $25500.

The MACD indicator is back over zero in the weekly time frame indicating a bullish trend.

We can see the formation of a bullish price crossover pattern with the adaptive moving average AMA 50 in the weekly time frame.

The MACD crosses up its moving average in the daily time frame indicating a bullish scenario.

The immediate short-term outlook for bitcoin is strongly bullish, the medium-term outlook has turned bullish, and the long-term outlook remains neutral under present market conditions.

Bitcoin’s support zone is located at $22460 which is a 14 day RSI at 50%, and at $23557 at which the price crosses the 9 day moving average stalls.

The price of BTCUSD is now facing its classic resistance level of 24381 and Fibonacci resistance level of 24426 after which the path towards 25000 will get cleared.

In the last 24hrs, BTCUSD has increased by 11.21% by 2462.33$ and has a 24hr trading volume of USD 46.508 billion. We can see an increase of 21.06% in the trading volume compared to yesterday, which is due to the buying seen at lower levels.

The Week Ahead

We have seen a Bullish correction in the prices of bitcoin and the resumption of a bullish trend which is expected to continue towards the $25000 levels.

With an increase in the global investor confidence, we can see an increase in the buying pressure and the trading volumes of bitcoin during the last 24hrs.

We can see the formation of a bullish doji star pattern in the 4-hour time frame.

The daily RSI is printing at 62.03 which indicates a strong demand for bitcoin and the continuation of the bullish phase present in the markets in the short-term range.

We can see the formation of a bullish trend line from $19552 towards the $24780 level.

The price of BTCUSD is now facing its resistance zone located at $25238 which is a 13-week high and $25814 which is a pivot point 1st resistance point.

The weekly outlook is projected at $25500 with a consolidation zone of $25000.

VIEW FULL ANALYSIS VISIT - FXOpen Blog...

Disclaimer: This Forecast represents FXOpen Companies opinion only, it should not be construed as an offer, invitation or recommendation in respect to FXOpen Companies products and services or as Financial Advice.
 
EUR/USD and EUR/JPY Aim More Upsides


EUR/USD is eyeing a steady increase above the 1.0750 resistance. EUR/JPY is rising and might rally further if it clears the 144.50 resistance zone.

Important Takeaways for EUR/USD and EUR/JPY

  • The Euro started a fresh increase above the 1.0700 support zone.
  • There is a key bullish trend line forming with support near 1.0740 on the hourly chart.
  • EUR/JPY started a steady increase after it found support near the 141.40.
  • There was a break above a major bearish trend line with resistance near 143.65 on the hourly chart.

EUR/USD Technical Analysis


The Euro remained well bid above the 1.0550 zone and started a fresh increase against the US Dollar. The EUR/USD pair was able to clear the 1.0620 resistance.

There was a clear move above the 1.0700 level and the 50 hourly simple moving average. The pair even climbed above the 1.0720 level and the 50 hourly simple moving average. The pair traded as high as 1.0759 on FXOpen and is currently showing positive signs.

On the upside, an immediate resistance is near the 1.0760 level. The next major resistance is near the 1.0780 level. The main resistance is near 1.0800.

A clear move above the 1.0800 resistance might send the price towards 1.0880. If the bulls remain in action, the pair could visit the 1.0950 resistance zone in the near term.

On the downside, the pair might find support near the 1.0740 level. There is also a key bullish trend line forming with support near 1.0740 on the hourly chart. The trend line is near the 23.6% Fib retracement level of the upward move from the 1.0678 swing low to 1.0759 high.

The next major support sits near the 1.0720 level or the 50% Fib retracement level of the upward move from the 1.0678 swing low to 1.0759 high, below which the pair could even test the 1.0680 support zone.

If there is a downside break below the 1.0680 support, the pair might accelerate lower in the coming sessions. In the stated case, it could even test 1.0620.

VIEW FULL ANALYSIS VISIT - FXOpen Blog...

Disclaimer: This Forecast represents FXOpen Companies opinion only, it should not be construed as an offer, invitation or recommendation in respect to FXOpen Companies products and services or as Financial Advice.
 
ETHUSD and LTCUSD Technical Analysis – 16th MAR, 2023


ETHUSD: Bullish Harami Pattern Above $1369

Ethereum was unable to sustain its bearish momentum and after touching a low of $1369 on 10th Mar, the price started to correct upwards against the US dollar touching a high of $1775 on 14th Mar.

We have seen a bullish opening of the markets this week.

The MACD indicator is giving a bullish divergence signal in the weekly time frame.

We can clearly see a bullish harami pattern above the $1369 handle which is a bullish pattern and signifies the end of a bearish phase and the start of a bullish phase in the markets.

ETH is now trading just below its pivot level of 1660 and moving into a mildly bullish channel. The price of ETHUSD is now testing its classic resistance level of 1705 and Fibonacci resistance level of 1761 after which the path towards 1800 will get cleared.

We can see the formation of bullish engulfing lines in the weekly time frame.

The relative strength index is at 55.18 indicating a strong demand for Ether and a shift towards the buying phase in the markets.

The STOCHRSI is giving an overbought signal, which means that the price is expected to decline in the short-term range.

Most of the technical indicators are giving a buy market signal.

Most of the moving averages are giving a buy signal at the current market level of $1650.

ETH is now trading above both its 100 hourly simple and 100 hourly exponential moving averages.

  • Ether: bullish reversal seen above the $1369 mark.
  • The short-term range appears to be mildly bullish.
  • ETH continues to remain above the $1600 level.
  • The average true range is indicating high market volatility.

Ether: Bullish Reversal Seen Above $1369


ETHUSD continues to build upwards momentum and we are now looking to cross the $1700 handle after which the next visible targets are located at the $1800 level.

The parabolic SAR indicator is giving a bullish reversal signal in the weekly time frame.

The MACD indicator is back over zero in the weekly time frame indicating a bullish scenario present in the markets.

We can see the formation of a bullish trend reversal pattern with the adaptive moving average AMA20 in the 4-hour time frame.

ETHUSD touched an intraday high of 1664 and an intraday low of 1634 in the Asian trading session today.

The key support levels to watch are $1559 at which the price crosses 9-day moving average stalls, and at $1587 which is a 14-day RSI at 50%.

ETH has decreased by 2.21% with a price change of 37.60$ in the past 24hrs and has a trading volume of 12.639 billion USD.

We can see a decrease of 18.80% in the total trading volume in the last 24 hrs. which appears to be normal.

The Week Ahead

ETH was successful in crossing the $1700 handle and touched a high of $1775 after which we can see some downwards correction. After the price stabilizes, we are looking for fresh upsides in the range of $1700 to $1800 levels.

We can see the formation of a bullish ascending channel from $1369 towards the $1687 level.

The immediate short-term outlook for Ether has turned mildly bullish, the medium-term outlook has turned bullish, and the long-term outlook for Ether neutral under present market conditions.

The resistance zone is located at $1710 which is a pivot point 1st resistance point and at $1781 which is a 1-month high.

The weekly outlook is projected at $1850 with a consolidation zone of $1800.

VIEW FULL ANALYSIS VISIT - FXOpen Blog...

Disclaimer: This Forecast represents FXOpen Companies opinion only, it should not be construed as an offer, invitation or recommendation in respect to FXOpen Companies products and services or as Financial Advice.
 
AUD/USD and NZD/USD Eyes Sustained Move Higher


AUD/USD started a fresh increase above the 0.6680 resistance zone. NZD/USD is rising and might aim a move above the 0.6250 resistance.

Important Takeaways for AUD/USD and NZD/USD

  • The Aussie Dollar started a fresh increase above the 0.6650 resistance against the US Dollar.
  • There is a key bullish trend line forming with support near 0.6680 on the hourly chart of AUD/USD.
  • NZD/USD started a decent increase above the 0.6200 resistance zone.
  • There is a major bullish trend line forming with support near 0.6180 on the hourly chart of NZD/USD.

AUD/USD Technical Analysis


The Aussie Dollar found support near 0.6590 and started a decent increase against the US Dollar. The AUD/USD pair gained pace for a move above the 0.6620 resistance.

The pair even moved above the 0.6650 level and the 50 hourly simple moving average. There was a clear move above the 61.8% Fib retracement level of the downward move from the 0.6711 swing high to 0.6589 low.

It is now trading above the 0.6700 level, plus above the 76.4% Fib retracement level of the downward move from the 0.6711 swing high to 0.6589 low.

On the upside, the AUD/USD pair is facing resistance near the 0.6710 level. The next major resistance is near the 0.6740 level. A close above the 0.6740 level could start another steady increase in the near term. The next major resistance could be 0.6800.

On the downside, an initial support is near the 0.6685 level. There is also a key bullish trend line forming with support near 0.6680 on the hourly chart of AUD/USD.

The next support could be the 0.6650 level and the 50 hourly simple moving average. If there is a downside break below the 0.6650 support, the pair could extend its decline towards the 0.6600 level.

VIEW FULL ANALYSIS VISIT - FXOpen Blog...

Disclaimer: This Forecast represents FXOpen Companies opinion only, it should not be construed as an offer, invitation or recommendation in respect to FXOpen Companies products and services or as Financial Advice.
 
Watch FXOpen's March 13 -17 Weekly Market Wrap Video

*In this video, FXOpen UK COO Gary Thomson sums up the week’s happenings and discusses the most significant news reports.

  • There will be more bank failures
  • Inflation data was not surprising. What will happen next?
  • Turkish Lira crisis lingers with sustained record low against USD
  • Oil updates the minimums of the year

Watch our short and informative video, and stay updated with FXOpen.


FXOpen YouTube


Disclaimer: This forecast represents FXOpen Companies opinion only, it should not be construed as an offer, invitation or recommendation in respect to FXOpen Companies products and services or as financial advice.

#fxopen #fxopenyoutube #fxopenuk #weeklyvideo
 

Create an account or login to comment

You must be a member in order to leave a comment

Create account

Create an account on our community. It's easy!

Log in

Already have an account? Log in here.

Similar threads

Users Who Are Viewing This Thread (Total: 1, Members: 0, Guests: 1)

Top
AdBlock Detected

We get it, advertisements are annoying!

Sure, ad-blocking software does a great job at blocking ads, but it also blocks useful features of our website. For the best site experience please disable your AdBlocker.

I've Disabled AdBlock    No Thanks