What's new

RoboForex - Forex Broker: overview and news

4.60 star(s) 7 Votes
How To Trade the Abandoned Baby Pattern

Author : Victor Gryazin


Dear Clients and Partners,

In this review, we will get acquainted with the candlestick analysis strong reversal pattern "Abandoned Baby". Let's look at the features of its formation, and the trading techniques for this pattern.

How the “Abandoned Baby” pattern is formed

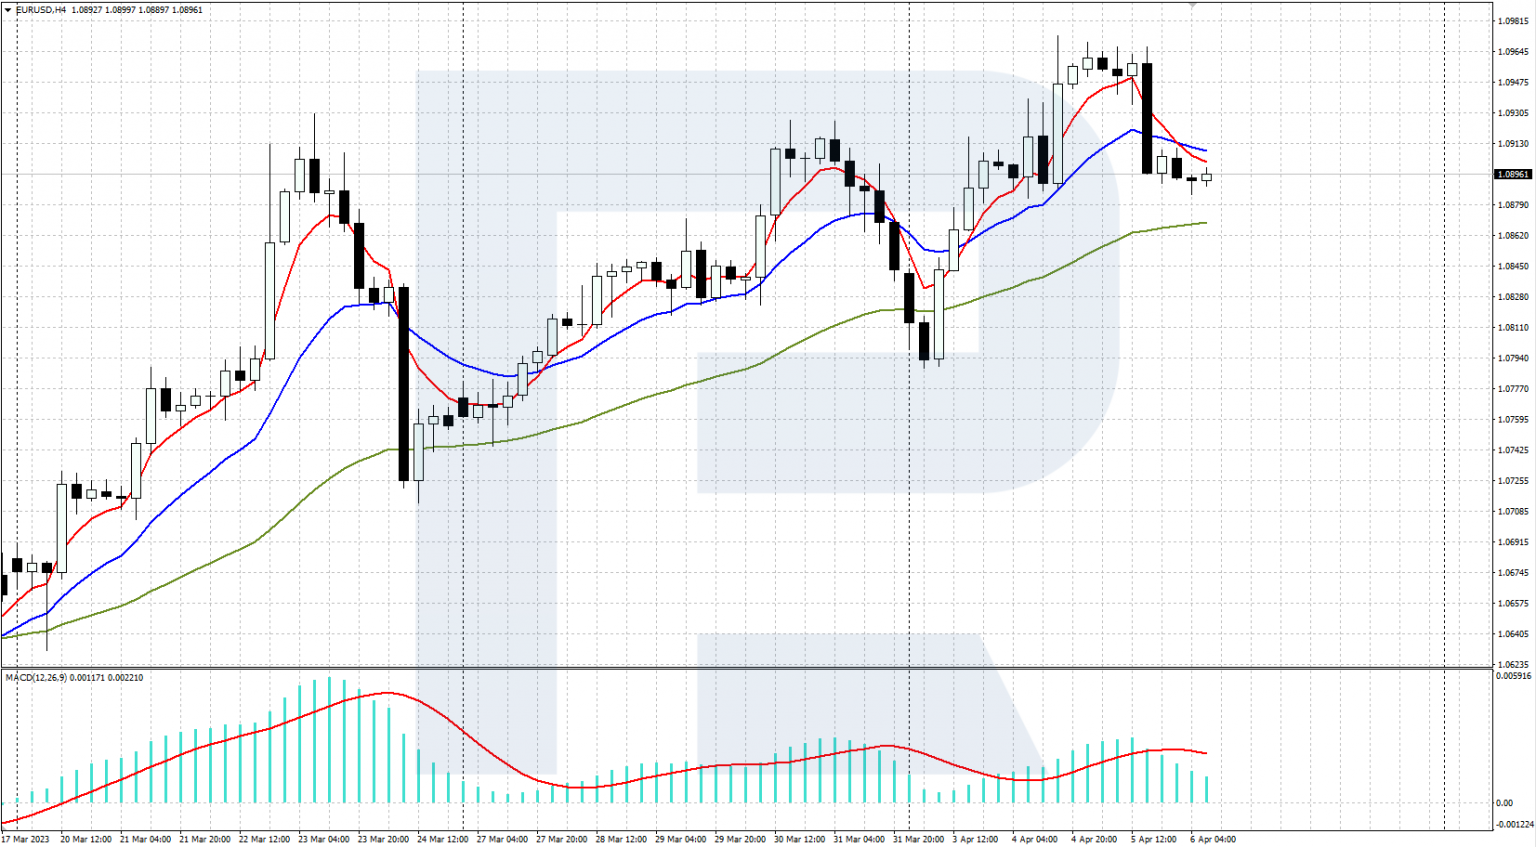
The Abandoned Baby candlestick pattern is a rare, strong reversal pattern that forms on the local highs and lows of the price chart. It consists of three candlesticks. The first one has a normal body, and the second one is a doji candle (it has practically no body, the open and close prices being almost the same). The third one closes in the opposite direction to the first candlestick. The second candlestick should have gaps (price gaps) on both sides.

As noted by the guru of candlestick analysis Steve Nison, the appearance of a doji after a strong white candlestick indicates the current overbought state of the financial instrument. And vice versa: the appearance of a doji after a black candlestick indicates an oversold condition of the asset. In the "Abandoned Baby" pattern, a doji opens with a gap from the first candlestick, followed by a gap in the opposite direction, with the third candlestick closing thereafter to confirm the reversal.

"Abandoned Baby" is very similar to "Morning Star" and "Evening Star" in its formation principle, but differs in the appearance of a doji candlestick with a gap on both sides. "Morning Star" and "Evening Star" do not require the average candlestick to be a doji or have gaps on both sides, so they are much more common on price charts.

“Bullish” pattern “Abandoned baby”

This is formed during a downtrend, at the lows of the price chart. The first black candlestick appears first. Against the backdrop of negative market sentiment, the next trading session opens with a gap down, but the "bears" do not succeed, and a doji appears on the chart. Seeing the weakness of the sellers, the bulls seize the initiative: the third candlestick opens with a gap up and closes with a confident white body.

A bullish "Abandoned Baby" reversal pattern forms on the chart as a result. Buyers have managed to seize the initiative, and are ready to keep pushing the price up. If the "bears" fail to close the gaps and drop the quotations below the doji low, the "bulls" are likely to go on the offensive and initiate an upward correction or even a trend reversal.

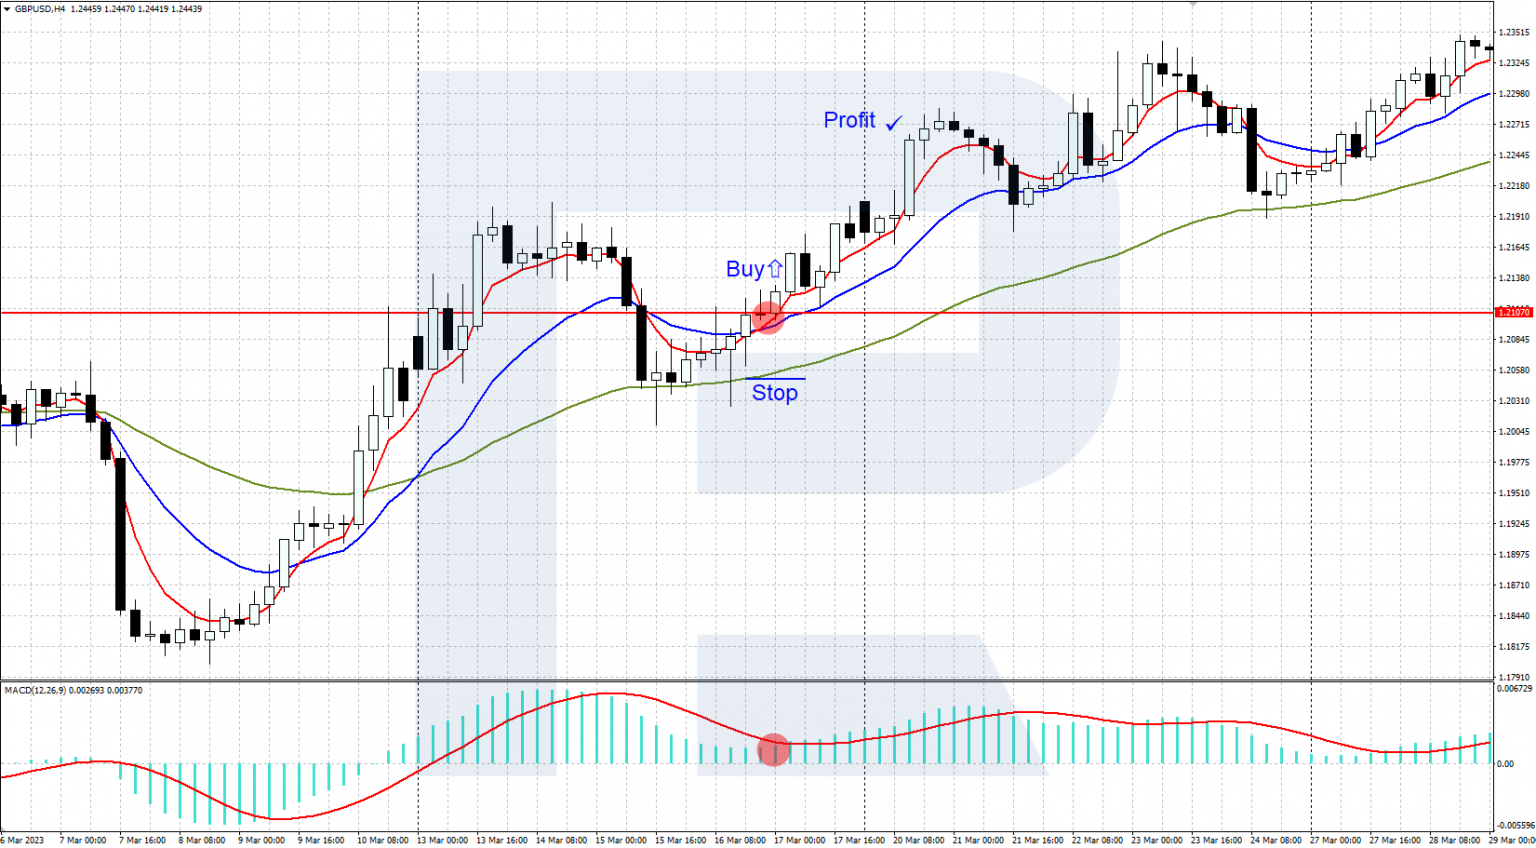
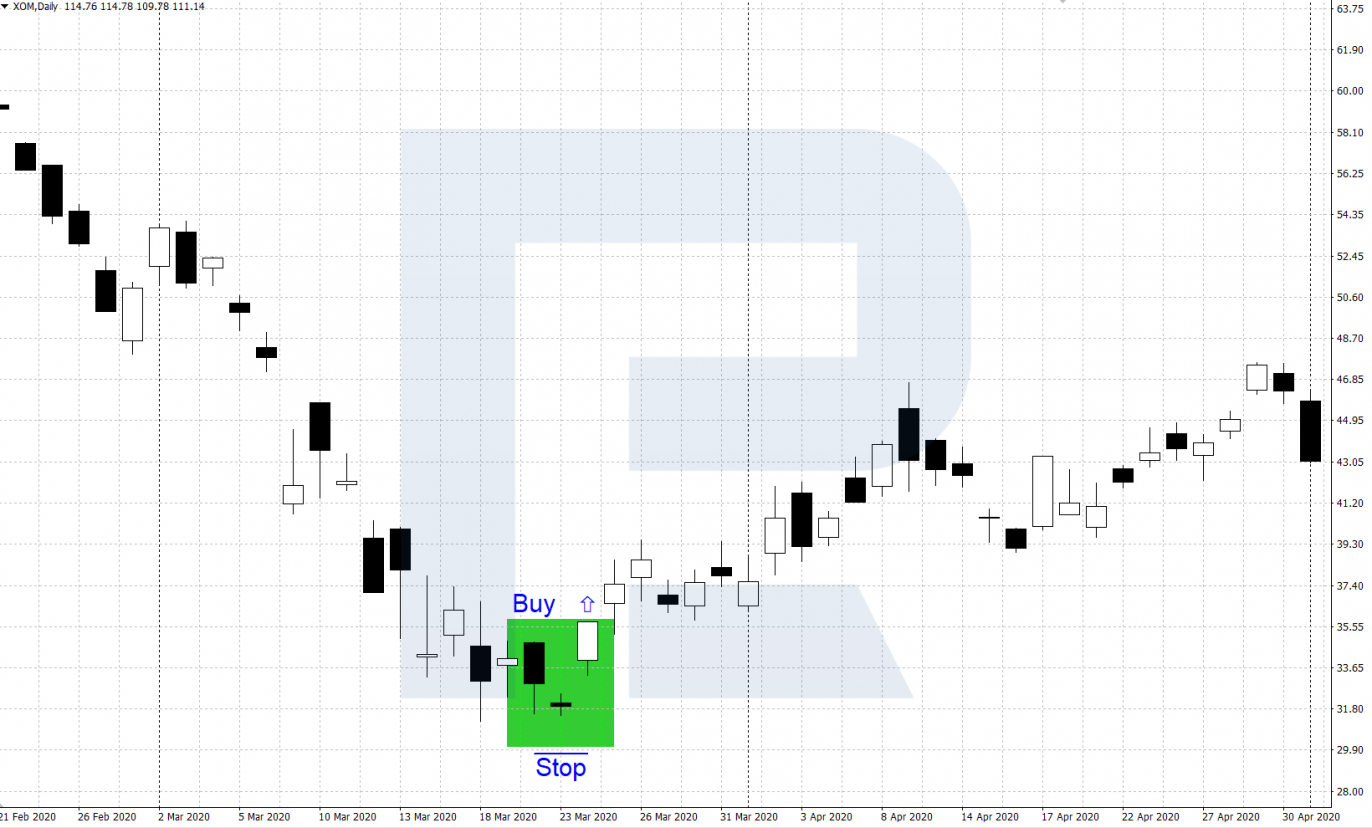
How to buy on the bullish “Abandoned Baby” pattern
  • During a downtrend, a bullish "Abandoned Baby" pattern appears on the local lows of the price chart
  • It is advisable to open a buy position when the price rises above the maximum of the third white candlestick in the pattern. Stop Loss is set at the doji low
  • To set Take Profit, you can be guided by Fibonacci retracement levels from the previous downtrend, significant support, and resistance levels


How to sell on the bearish “Abandoned Baby” pattern
  • During the upward trend, a bearish "Abandoned Baby" pattern is formed at the local highs on the price chart.
  • A sell position can be opened after the price decreases below the third black candlestick in the pattern. Stop Loss is set at the doji's maximum.
Read more at R Blog - RoboForex

Sincerely,
RoboForex team
 
How to Choose a Timeframe for Trading?

Author : Victor Gryazin


Dear Clients and Partners,

In this review, we will speak about choosing a timeframe for trading. This is an important part of your trading strategy.

What is a timeframe?

A timeframe is a time interval for representing the quotations on the chart. As a rule, price movement is represented on the chart as candlesticks (or bars) with the same period, corresponding to the chosen timeframe. The larger the timeframe, the bigger "volume" of the price movement is shown by each candlestick on the chart.

You may set up any timeframe for the price chart but normally traders use basic conventional timeframes:
  • MN is a monthly timeframe, each candlestick shows the price movement during a month.
  • W1 is a weekly timeframe, each candlestick shows the price movement during a week.
  • D1 is a daily timeframe, each candlestick shows the price movement during a day.
  • H4 is a four-hour timeframe, each candlestick shows the price movement during four hours.
  • H1 is an hourly timeframe, each candlestick shows the price movement during an hour.
  • M30 is a 30-minute timeframe, each candlestick shows the price movement during 30 minutes.
The timeframe is chosen in the trading terminal. In such popular terminals as MetaTrader 4 and MetaTrader 5, there is a table of active buttons for the main timeframes on the Instrument board. Left-clicking the buttons, you can quickly switch from one timeframe to another.


How to choose a timeframe?

To analyze the price chart, we normally use not one but several timeframes. Analyzing the price movements on several timeframes, the trader receives a vaster picture of the dynamics of the financial instrument. This helps to forecast price movements for different intervals depending on your trading strategy.

While for the general analysis of your financial instrument you may use all timeframes at once, for making trades you need a "narrower horizon". In many trend strategies based on the main rules of tech analysis, we usually choose two timeframes:

Timeframes for long-term trading

Long-term trading normally means a relatively small number of trades that remain in the market for a long time - from several weeks to several months. This trading style is similar to investing: you choose an instrument that promises a substantial movement and make decision mostly based on fundamental analysis.

Criteria for long-term trading:
  • Little time for trading: you spend less than 1/5 of your worktime on it.
  • The deposit is large, you may enter the market with a large position for a long term, place big Stop Losses, and withstand deep drawdowns (from 50,000 USD).
As the main timeframe for long-term trading, on which you will define the main trend and its aim, the MN (monthly) and W1 (weekly) timeframes will be the best. As an additional timeframe for finding entry points, use D1. In the picture, you can see these timeframes in use:

Read more at R Blog - RoboForex

Sincerely,
RoboForex team
 
Setting Up the "Support and Resistance Based on 240 Bars" Trading Strategy

Author : Andrey Goilov


Dear Clients and Partners,

Today we will look at the medium-term Support and Resistance Based on the 240 Bars strategy. Support and resistance levels will be automatically plotted using the SF Trend Lines indicator as "bullish" and "bearish" channels. The strategy involves trading the pairs EUR/USD, GBP/USD, USD/JPY, USD/CAD, USD/CHF, and NZD/USD on the four-hour chart.

In this article we will explain how to add the indicator to the trading terminal, discuss the rules for opening and closing positions, as well as the subtleties of setting Stop Loss and Take Profit.


Setting up the SF Trend Lines indicator
  • Download SF Trend Lines
  • Add it to the installed trading terminal by opening the MQL4 folder and pasting it into the Indicators folder
  • Add an indicator to the chart in MT4, working from the menu: Insert → Indicators → Custom → sf-trend-lines
  • You can change the colour of the trend lines in the settings, but it is important to leave the number of bars at 240 unchanged
SF Trend Lines builds a price channel with the upper boundary acting as critical resistance, so a pullback is expected from it. The lower boundary of this channel is a critical support area, so an upward bounce is expected from it.

The indicator does not build the entire chart with channels; it builds only the actual channel, which means you cannot assess the quality of signals on the history of the chart – only in real time. There can only be one channel on the H4 chart.

How to Buy with Support and Resistance Based on 240 Bars

1. The price should reach the bottom of the uptrend channel on the SF Trend Lines indicator chart.

2. The Williams' Percent Range (Williams' %R) indicator can be used as a confirmation signal. Its values should fall below the -80 level.

3. Stop Loss can be set behind the lower boundary line of the SF Trend Lines channel. If the price has already fallen below this line and rebounded, then the Stop Loss should be set 5-10 points below the candlestick's low.

4. Take Profit is based on a 1:4 profit/loss ratio. If Stop Loss is 30 points, Take Profit is 120.

Support and Resistance Based on the 240 Bars Buying Example
  • On the chart of the currency pair EUR/USD on 6 February 2023, after rebounding from the upper boundary of the "bullish" channel where there was a strong resistance level, the price fell and tested the support line of the indicator SF Trend Lines
  • The Williams' %R indicator was below -80, indicating that the currency pair was severely oversold

  • A long position was opened at 1.0786
  • The stop loss was placed below the support line, at 1.0756. Its size is 30 points
  • Take Profit was set at 1.0906 Its size is four times the size of the Stop Loss
Read more at R Blog - RoboForex

Sincerely,
RoboForex team
 
RoboForex: upcoming changes to the trading schedule in view of Presidents' Day in the US


Dear Clients and Partners,

We are informing you that there will be some changes to the trading schedule during the Presidents' Day in USA.

This schedule is for informational purposes only and may be subject to further change.

MetaTrader 4 / MetaTrader 5 platforms

Schedule for trading on CFDs on US indices (US30Cash, US500Cash, USTECHCash) and Japanese index JP225Cash
  • 20 February 2023 – trading stops at 7:40 PM server time.
  • 21 February 2023 – trading starts as usual
.
Schedule for trading on Metals (XAUUSD, XAGUSD) and CFDs on oil (Brent, WTI)
  • 20 February 2023 – trading stops at 7:40 PM server time.
  • 21 February 2023 – trading starts as usual.
Schedule for trading on CFDs on US stocks
  • 20 February 2023 – no trading.
  • 21 February 2023 – trading starts as usual.
R StocksTrader platform

Schedule for trading on US stocks and ETFs
  • 20 June 2022 – no trading.
  • 21 June 2022 – trading starts as usual.
Schedule for trading on CFDs on US stocks and ETFs
  • 20 June 2022 – no trading.
  • 21 June 2022 – trading starts as usual.
Schedule for trading on US Stocks, US ETFs, CFDs on US Stocks and ETFs
  • 20 February 2023 – no trading.
  • 21 February 2023 – trading starts as usual.
Schedule for trading on Metals (XAUUSD, XAGUSD), CFDs on Crude Oil (BRENT.oil, WTI.oil) and US Indices (US500, US30, NAS100)
  • 20 February 2023 – trading stops at 7:40 PM server time.
  • 21 February 2023 – trading starts as usual.
cTrader platform

Schedule for trading on Metals (XAUUSD, XAGUSD)
  • 20 February 2023 – trading stops at 7:40 PM server time.
  • 21 February 2023 – trading starts as usual.
Please take note of the above trading schedule changes when planning your trading activity.

* – This schedule is for informational purposes only and may be subject to further change.

Sincerely,
RoboForex team
 
RoboForex: upcoming changes to the trading schedule in view of Presidents' Day in the US


Dear Clients and Partners,

We are informing you that there will be some changes to the trading schedule during the Presidents' Day in USA.

This schedule is for informational purposes only and may be subject to further change.

MetaTrader 4 / MetaTrader 5 platforms

Schedule for trading on CFDs on US indices (US30Cash, US500Cash, USTECHCash) and Japanese index JP225Cash
  • 20 February 2023 – trading stops at 7:40 PM server time.
  • 21 February 2023 – trading starts as usual
.
Schedule for trading on Metals (XAUUSD, XAGUSD) and CFDs on oil (Brent, WTI)
  • 20 February 2023 – trading stops at 7:40 PM server time.
  • 21 February 2023 – trading starts as usual.
Schedule for trading on CFDs on US stocks
  • 20 February 2023 – no trading.
  • 21 February 2023 – trading starts as usual.
R StocksTrader platform

Schedule for trading on US Stocks, US ETFs, CFDs on US Stocks and ETFs
  • 20 February 2023 – no trading.
  • 21 February 2023 – trading starts as usual.
Schedule for trading on Metals (XAUUSD, XAGUSD), CFDs on Crude Oil (BRENT.oil, WTI.oil) and US Indices (US500, US30, NAS100)
  • 20 February 2023 – trading stops at 7:40 PM server time.
  • 21 February 2023 – trading starts as usual.
cTrader platform

Schedule for trading on Metals (XAUUSD, XAGUSD)
  • 20 February 2023 – trading stops at 7:40 PM server time.
  • 21 February 2023 – trading starts as usual.
Please take note of the above trading schedule changes when planning your trading activity.

* – This schedule is for informational purposes only and may be subject to further change.

Sincerely,
RoboForex team
 
How To Use the Rate of Change (ROC) Indicator in Trading

Author : Victor Gryazin


Dear Clients and Partners,

In this material, we will introduce you to the Rate of Change trading indicator. We will consider the peculiarities of its work, the formula for its calculation, and the signals that can be used in trading.

What the Rate of Change indicator shows

Rate of Change is a technical indicator showing the magnitude and speed of price change over a specific period. It compares the quotation of the current time period with the past ones, indicating the percentage of change in the price. The obtained data helps to evaluate the current dynamics of the selected financial instrument. Rate of Change is like the popular Momentum indicator.

ROC helps to determine what kind of trend the market is currently in and whether it is accelerating or slowing down. The greater the growth of the indicator, the stronger the optimism of the market crowd and the higher the probability that prices will continue to rise. A drop in the indicator value indicates an increase in pessimism in the market and the likelihood that prices will continue to fall.

Rate of Change is plotted in a separate window below the price chart and is represented as one main calculation line and a horizontal 0 level. The ROC line confirms (or does not confirm) the breakdown and rebounds from the support and resistance lines on the price chart, and helps determine the direction of the current market trend:
  • A rising ROC above 0 confirms that an upward trend is in force
  • A below 0 and falling ROC confirms the presence of an active downtrend

The formula for calculating the Rate of Change

ROC = (Close(i) - Close(i-n)) / Close(i-n) * 100%

Where:
  • Close(i) - the last closing price.
  • Close(i-n) - closing price of n periods ago.
  • n - is the period of the indicator.
This indicator in its classic version is used with a default period of twelve. It is always possible to experiment, evaluate its work with other periods on historical data, and choose the most suitable one for your trading.

Installing Rate of Change in the trading terminal

Rate of Change is not a pre-installed indicator, so to use it in the popular MetaTrader 4 terminal, you need to download and install the indicator file. The file can be found on the Internet or on the website of MetaQuotes Ltd.

To install the indicator in the MetaTrader 4 main menu, go to File, select Open Data Folder → MQL4 → Indicators, and copy the file to this folder. After restarting the terminal, ROC will be installed in the Custom Indicators folder.

Next, install it on the chart of the desired instrument through the main menu of the programme: Insert → Indicators → Custom → ROC. It is usually used with default settings (Rperiod=12), you can customise the colour and style of the main line.

Rate of Change trading signals

Rate of Change is not a pre-installed indicator, so to use it in the popular MetaTrader 4 terminal, you need to download and install the indicator file. The file can be found on the Internet or on the website of MetaQuotes Ltd.

To install the indicator in the MetaTrader 4 main menu, go to File, select Open Data Folder → MQL4 → Indicators, and copy the file to this folder. After restarting the terminal, ROC will be installed in the Custom Indicators folder.

Read more at R Blog - RoboForex

Sincerely,
RoboForex team
 
How to Choose a Currency Pair for Trading in Forex?

Author : Victor Gryazin


Dear Clients and Partners,

A beginner trader often asks themselves: which currency pair should they choose for trading? In this review, I will address the most popular currency pairs and enumerate the criteria for choosing the most suitable ones.

What is a currency pair?

A currency pair is the quotation of two different currencies that constitutes a currency rate and acts as an object of operations in Forex.

The standard view of a currency pair is:

Base currency/Quote currency

A trade operation means that the trader sells or buys the base currency against the quote currency.

The base currency is the one on the left – it is the currency that you sell/buy. The quote currency is the one to the right – it expresses the price of the base currency.

For example, look at the EUR/USD (Euro vs US Dollar) currency pair:
  • EUR is the euro, base currency
  • USD is the American dollar, quote currency
  • The current exchange rate of EUR/USD is 1.1270. which means 1 euro costs 1.1270 US dollars.
Forex is the world's largest financial market, displaying the current dynamics of global trade. It features a huge number of currency pairs – from famous to exotic ones. The most popular currency pairs which constitute the biggest volume of world trade are called major pairs. They are most often used for trading.

The characteristics of major currency pairs

Major currency pairs in Forex and the pairs that consist of the most popular currencies of the world economy. Presently, such currencies are the USD, EUR, JPY, CHF, GBP, NZD, AUD, CAD. It would be logical to add the CNH, or the Chinese yuan, here, but the rate of this currency is controlled by the Central Bank of China, so the CNH is not traded that actively.
  • EUR/USD is the euro vs the US dollar. It is the most popular currency pair. The trade volume of the currency pair is maximal here, while the spread is small and volatility is average. It is most active during the European and American sessions and reacts vividly on the news in the Eurozone.
  • USD/CHF is the US dollar vs the Swiss franc. Most often, it goes counter the euro/dollar pair; it moves calmly and has a small spread. The Swiss franc is a safe-haven asset, thus the pair may go down during crises. It is most active during the European and American sessions.
  • GBP/USD is the British pound vs the US dollar. The currency pair has increased volatility and is popular among traders. It may demonstrate mighty movements of several patterns or trigger nearby Stop Losses by false breakaways. The pound reacts dramatically to political events and economic data in Britain. The pair is most active during the European and American sessions.
How many currency pairs do we use in trading?

Many traders wonder how many currency pairs they should use in trading. I think, there are two approaches to the issue depending on your trading style:

Minimum pairs

This approach is based on the fact that each currency pair is peculiar, and the nuances of its behavior may be studied if you focus on one or two pairs. Spending some time on mastering one pair, learning the factors that influence it (important news, macroeconomic statistics), you may get a certain advantage.

A wide range of pairs

This approach is based on the use of certain trading patterns, Price Action patterns, candlesticks, etc. Having learned to find some pattern on the price chart and having made sure of its efficacy, we may start trading. For this approach, using a lot of currency pairs is reasonable: you scan the charts, find patterns, and get started.

Read more at R Blog - RoboForex

Sincerely,
RoboForex team
 
Larry Connors' Double 7 Trading Strategy

Author : Victor Gryazin


Dear Clients and Partners,

In this material, we will get acquainted with the "Double 7" medium-term trading strategy of the famous trader Larry Connors. We will learn what it is based on, and how it can be used in trading. We will consider its advantages and disadvantages and give an example of trading using this strategy.

How the Double 7 strategy works

The Double Seven is a fairly simple trading system that was introduced in the book “Short-Term Trading Strategies That Work”. It was written by the famous investment consultant and stock trader Larry Connors in co-authorship with the developer of trading systems Cesar Alvarez. The strategy was created for trading in the stock market, and the authors used it to trade major stock indices (S&P 500, Dow Jones) or index ETFs.

The Double 7 is based on the concept that when trading major market indices, an effective strategy is to buy on pullbacks in a major uptrend. A valid uptrend is defined as the price being above the 200-day Moving Average. A pullback is defined as a close below the lowest low of the last seven days, in which case a buy is opened. Once a buy is opened, one must wait for a new seven-day high to close the position.

After reading the trading rules, we can see that the "Double Seven" was developed for daily charts and is only used to open and close long positions in a rising market. That is, it works only in one direction – to buy the asset, shorts (short positions) are not used in this strategy and Stop Loss orders are not set. When tested by Connors and Alvarez, the system showed positive results on stock indices, ETFs, and highly liquid US stocks.

Setting the Moving Average indicator

This strategy uses the Moving Average indicator to determine the current trend. Moving averages are included in most modern trading terminals, plotted directly on the price chart. In the popular trading platforms, MetaTrader 4 and MetaTrader 5, you can install the Moving Average on the chart of the selected instrument through the Main Menu: Insert → Indicators → Trending → Moving Average. In the setup window that appears, select period 200, line colour and thickness, MA method: Simple.


How to trade the Double 7 strategy

The algorithm for using the strategy in trading:
  1. The price chart should be above the 200-day moving average, indicating an uptrend.
  2. We must wait for the day to close at the low of the last 7 days.
  3. If points 1 and 2 are met, a buy position is opened.
  4. The signal for exiting a position is to close the day at the seven-day high.
Advantages and disadvantages of the Double 7 strategy

Advantages:
  • Works well in a rising market, giving entry points into an uptrend after small corrections. The strategy generates profitable trades, as long as there is a strong uptrend
  • There is no "stop order" in high market volatility, as no Stop Losses are placed
Disadvantages:
  • At the end of an uptrend and a downward reversal, the trading performance declines sharply
  • There is no possibility of trading short positions (shorts) during a downtrend
  • Lack of Stop Losses can lead to prolonged and significant drawdowns of the trader's deposit
Read more at R Blog - RoboForex

Sincerely,
RoboForex team
 
How to Beat Greed in Forex?

Author : Victor Gryazin


Dear Clients and Partners,

The ability to control your emotions lies at the basis of your expertise as a trader. If a trader falls prey to their emotions, they lose control over their trading. This means breaking the rules of your trading system and, as a rule, ends in losing your money.

In this overview, we will discuss what is greed in Forex and how to beat it.

How does greed appear?

Many people start trading in the hope they will get rich in a short time. This misjudgment is supported by fantastic stories of success spread by the media. You might have heard of a young trader from the US Timothy Sykes who started trading in high school and earned his first million by the age of 21. Sounds amazing, doesn't it?

However, many neglect the fact that Sykes achieved this by long and painful training, making mistakes, losing money, but perfecting his strategy, and coping with his emotions. Experiences traders know that trading provokes the strongest human feelings and passions that you need to bring under control. A bright example is greed that can lead to losses and depression if you let it rule.

Greed is an unstoppable desire to own more and more fortune. Some might say that this is all personal, and there is nothing reproachable in the craving for more. However, greed is usually accompanied by unrealistic expectations and hopes, and a lack of self-control. This becomes a large stumbling rock in the trader's way to success because they start breaking their trading rules, which leads to losses.

Also, greed increases stress and nervousness that nag on the trader throughout their work. This is a direct way to exhaustion that makes it difficult to think rationally about trading in financial markets altogether. Hence, you need to know how to detect greed in the early stages and fight.

Main symptoms of greed

Let us have a look at the main symptoms that signal the advent of greed.
  • Unrealistic expectations
Ambitions are great when they are rational. However, when it comes to money, one's common sense often loses the battle to greed, especially if the first couple of trades was a success. Trading on a demo account, which is where most traders start from, is peculiar in the sense that there is no psychological barrier in it — the money is not real. On a demo account, trading is fun.

That is why many over-ambitious traders rush at switching to a real account. They think that if they made it on a demo, real trading will also go smoothly, so why to waste your time on sheer practice. Their expectations are too high, they imagine how they become millionaires in a week. However, real trading quickly sobers them, but the lack of due preparation and money-management skills leads to losses.
  • Poorly based hopes
A poorly based hope for a profit must in no way be the moving force for a trader. Such hopes, having no real support, lead to increased risks. This feeling is characteristic mostly of beginners, who hope that their trades will for sure bring them a profit if they wait for a little.
A classic example: a trader opened a trade and waits for the price of the asset to reach the desired level. But the market goes another way, and the trader obediently watches their deposit melt. Nonetheless, they do not close the position hoping that the market will soon reverse in their direction. This does happen sometimes but most often, this hope never comes true, and the trader suffers a serious loss.

Ways to control greed

To control your greed and prevent it from harming your trading, you have several proven methods:
  • Stick to your trading rules
The main instrument that helps traders beat greed is a reliable trading system. The latter is a set of certain rules that trading is based on. If a trader sticks to the rules, their greed is under control. They make trades based on clear signals, not the dream to become rich.
  • Track your emotional state
You must always know what and why you are feeling. If you feel that you have lost emotional balance, pause for a while. It will be wise to stay away from the market for a short while after a series of losing or profitable trades. Such series can provoke strong emotions that might harm your trading. Hence, you should stop and calm down before carrying on with your work in your normal balanced state of mind.
  • Control your risks
Risk control is an intrinsic part of trading. Money management is a way to manage your capital by a certain risk control pattern. In other words, this is a way to choose the part or share of your assets that you are ready to risk in each trade. Wise risk control helps you protect your deposit from greed and other emotions.
  • Use pending orders
The use of pending Stop Loss and Take Profit orders decreases the influence of greed on your trading. A Stop Loss limits losses (and protects the profit) when the market turns against the trader. A Take Profit will lock in your profit when the price reaches the specified value. This order helps to close a trade in time near the levels from which the price might correct or reverse.

Closing thought

Greed frequently harms trading in financial markets. Uncontrolled greed makes you violate your trading rules and might lead to serious losses. Hence, you need to detect the symptoms of greed accurately and use proven ways of beating it.

Read more at R Blog - RoboForex

Sincerely,
RoboForex team
 
How to Test a Trading Strategy

Author : Victor Gryazin


Dear Clients and Partners,

Today we will explain how to test a trading strategy. We will begin by explaining what a trading strategy is, why it needs to be tested, and how to do this. We will also give you some important recommendations.

What is a trading strategy?

A trading strategy is a trader's main tool that gives them an advantage in the market. In other words, it is a set of trading rules that have been tested in practice. The strategy can be considered successful if the total result of all deals made by using it within a specific period (month, quarter, year) is positive, i.e., profitable.

A trader's failure to have a clear, understandable, and practically proven system when trading can lead to a loss of funds. Making profit from random unsystematic trades is possible, but it will mostly depend on luck rather than experience and knowledge. You can only be successful in the long run if you use a proven trading strategy.

Why test a trading strategy?

Backtesting is the process of assessing how well a trading strategy can perform under past conditions. It is a key component in developing an effective system. There are various possibilities to change strategy parameters, and the adjustments made can have a significant impact on the results. Such testing shows the overall performance of an idea and checks whether some trading parameters will work better than others.

Testing the chosen trading approach on past data allows you to assess its effectiveness without any real monetary investment. The basic logic behind such testing is the assumption that a system that has worked well in the past is likely to also be effective now. Correct backtesting on historical data and obtaining positive results increases the trader's confidence that the idea will work. If the backtest shows negative results, the parameters should be changed or the chosen strategy should be abandoned.

Ways to test a trading strategy

You can test your trading approach on historical data or real trading conditions, either manually or by using special programmes.

Manual backtesting

Manual testing with historical data is a rather time-consuming process. This method is used when automated testing cannot be used for one reason or another.

Manual test scheme:
  1. A chart of the financial instrument is opened. All necessary indicators and tools for trading according to the strategy are installed. The desired timeframe and the period of interest in the quotes history are selected.
  2. The strategy then searches the chart for setups (conditions) for trades.
  3. When a strategy is detected, the trader records all parameters of the potential trade: date, entry point, direction, Stop Loss, Take Profit, trade result, and any other useful information.
  4. After a careful examination of all the potential trades found, their individual results and the total are analysed. A conclusion is made as to whether trading on this system will bring profit or loss.
If the strategy works at a loss, it is abandoned, or adjustments are made to improve its effectiveness. After the changes have been made, the strategy is checked again, and the process is repeated until it achieves an acceptable result. Manual testing of a trading strategy on historical data takes time and discipline. Correctly performed testing creates the conditions for a more accurate understanding of the level of success of the chosen approach and allows you to improve the practical skills of identifying setups for trading.


Automated backtesting

Special software is used that finds trades that meet the strategy's criteria. It summarises profitable and losing trades to show whether the strategy has been effective over a certain period of time. There are many trading platforms that provide such testers nowadays.

Read more at R Blog - RoboForex

Sincerely,
RoboForex team
 
How To trade the GBP/JPY Strategy Using the Bollinger Bands

Author : Andrey Goilov


Dear Clients and Partners,

Today we will look at a short-term trading strategy based on the Bollinger Bands indicator with different timeframes. It is designed to work with the currency pair GBP/JPY on the M1 chart.

GBP/JPY is a highly volatile instrument, and the technical indicator will indicate instants when the price diverges significantly from its average fluctuation and there is a high probability of a move in the opposite direction.

How to trade GBP/JPY with the Bollinger Bands strategy


We will show you how to use Bollinger Bands signals with three different deviation values. We will look at the position opening and discuss the Stop Loss and Take Profit rules according to the strategy.

Bollinger Bands in brief

Bollinger Bands is designed as a trend indicator, and it can show not only the direction of the current trend but also estimate volatility. It has three lines: a simple moving average with a period of 20 is positioned in the middle, while two other lines are positioned above and below, estimating maximum and minimum values. The extreme lines act as a floating support and resistance levels.

According to the author of Bollinger Bands, prices spend 95% of the time in the area between the bands of the indicator. Therefore, any price move out of this corridor can be seen as a reversal possibility and an imminent return of prices to average values.


The behaviour of Bollinger Bands during strong market trends is also interesting. As a rule, in an uptrend, an investor wants to buy at the lowest price. In this case, one should expect the price to test the lower boundary of the indicator. In a downtrend, the investor wants to sell at the maximum price. In this case, the price is expected to test the upper boundary of the indicator.

How to set up Bollinger Bands
  • Add the Bollinger Bands indicator to the chart. To set the drawing period and colour of lines, double left-click on the indicator in the chart or right-click once and select "Properties" in the menu that appears. Then change the colour of the lines and the deviation value in the opened settings window.
  • Bollinger Bands with deviation 2 - select the red colour of the lines. Extreme lines of the indicator characterise the nearest support and resistance levels. According to the author of the indicator, the price very rarely moves beyond these lines
  • Bollinger Bands with deviation 3 - choose the blue colour of the lines. According to the author of the indicator, price moves beyond these lines are even rarer
  • Bollinger Bands with deviation 4 - choose the green colour of the lines. According to the author of the indicator, the price will reach these lines as rarely as possible, only at moments of peak volatility in the market
Read more at R Blog - RoboForex

Sincerely,
RoboForex team
 
Reversal Patterns: How to Detect a Change in Trend Direction?

Author : Maks Artemov


Dear Clients and Partners,

Imagine a distinct uptrend that has long been in the market. How do we know when it is over? Or, if a descending dynamics last long, how do we know where it reverses? These are the questions that many traders are perplexed by.

There is no unique answer to this question. The trend may reverse at any time, so the trader's task is to detect the time and place. There are lots of theories, practices, indicators, and other ways of market analysis meant for this.

Today, I will speak about a classical method of detecting a trend reversal. Watching the charts, market players have come to certain conclusions about the laws of price movements. At specific moments, the impulse comes to an end, and the trend changes its direction. Let us have a look at a group of reversal patterns, which are likely to precede a trend reversal.

What patterns do we look for?

Before speaking about reversal patterns, a small remark: candlestick patterns may have different names in different strategies and translations; moreover, they may differ slightly in appearance, however, their essence remains the same.

The main candlestick patterns at the top of the trend would be:
  • Shooting Star
  • Hanging Man
  • Doji
  • Gravestone Doji
  • Harami
  • Engulfing
Reversal patterns at the top of the trend

One condition, common for all reversal patterns, is the presence of a strong support or resistance level and a long-term trend.

Shooting Star

It looks like a candlestick with a small body and a very long upper shadow. It normally forms after the abrupt growth of the quotations. The lower shadow, in this case, will be short. Ideally, the body of the candlestick and the impulse have opposite colors (after a row of growing candlesticks, the Shooting Star is a descending one).


Hanging Man
.
In essence, it is an inverted Shooting Star. The upper shadow is minimal or lacking, the body looks small, the lower shadow looks rather long. The Hanging Man is similar to the Hammer.

Doji

These candlesticks may form at any place of the chart and still have the name Doji. Other candlesticks are different, and we will discuss them later on.

A Doji looks like a cross or a "+". This means it has tiny shadows, and its body looks like a line because the opening and closing prices are on one line. Some Dojis have two long shadows and are called Legged Dojis; however, the signal they give is the same.

Reversal patterns at the bottom of the trend

Now - to the reversal patterns at the bottom of the trend. I should make it clear that the candlestick patterns themselves may look absolutely identical to those that form at the peak of the trend; however, they have different names. The work off is also the same: a trend reversal.

Hammer

It looks like the Hanging Man: a small body, a small or lacking upper shadow, and a long lower shadow. The only difference is that the pattern forms at the bottom of the trend.


Inverted Hammer

It is similar to the Shooting Star: a long upper shadow, a small body, and an almost lacking lower shadow. Like the Hammer, it forms at the bottom of the trend.

Engulfing

It consists of two candlesticks. The first descending bar has a short body, the second one is visually larger, and its body covers up the projection of the first pattern.

Read more at R Blog - RoboForex

Sincerely,
RoboForex team
 
How To Trade the "Moving Averages Based on Fibonacci Numbers" strategy

Author : Victor Gryazin


Dear Clients and Partners,

In this article, we will look at a medium-term indicator trading strategy using multiple moving averages based on Fibonacci numbers. We will find out which indicators to set and talk about the rules for making trades.

How the strategy works

Fibonacci numbers originated with the famous Italian mathematician Leonardo of Pisa, who was better known as Fibonacci. He investigated an infinite mathematical sequence that was later named after him. In it, each successive number is equal to the sum of the previous two numbers: 0, 1, 1, 2, 3, 5, 8, 13, 21, 34, 55, 89, 144, and so on.

Dividing the previous number in the sequence by the next number gives 0.618. Dividing the previous number in the sequence by the next number through one produces 0.382. The golden ratio is based on this relationship. With the advent of exchange trading, the Fibonacci sequence began to be used in trading. Various tools based on Fibonacci numbers can be found in almost any trading platform.

This strategy uses the intersection of four exponential moving averages (EMAs) with periods corresponding to the Fibonacci numbers (5, 8, 13, 21) to find trading signals. Moving averages have long established themselves as a simple and effective tool for trend analysis.

When all four moving averages are moving horizontally and intertwined, this is a sign that the market is in a sideways corridor and there is no clear trend. When the price is rising and indicator lines begin to diverge and move upwards, this signals the beginning of an uptrend. When the price decreases and the indicators diverge moving downwards, it indicates the beginning of a downtrend.


How to install the Moving Average indicator

The Moving Average indicator is included in most modern trading terminals, displayed directly on the price chart. In the popular MetaTrader 4 and MetaTrader 5 trading platforms, you can install the Moving Average on the chart of the selected instrument through the Main Menu: Insert → Indicators → Trends → Moving Average.

In the window that appears, select period 5, colour and thickness of the line, and method MA: Exponential. Repeat these steps to set up three more moving averages with periods of 8, 13, and 21, selecting different colours for the indicator lines. This will result in four differently coloured moving averages on the price chart, which will be used to search for trading signals according to the strategy.

How to use the strategy in trading

This strategy is quite versatile and can be used on different timeframes and financial instruments. To trade, you have to wait for the price to move up or down out of the sideways range. In a sideways range, all four moving averages are intertwined and move horizontally – there are no trading signals.

A buy signal for the strategy
  • The price begins to rise, crossing all four moving averages from bottom to top, renewing the nearest local high
  • The moving average lines cross and begin moving upwards, gradually diverging from each other
  • A buy position is opened, and the Stop Loss is set at the nearest local low, which is below the moving averages
  • Take Profit is taken when the moving averages are crossed in the opposite direction, or when the price reverses and closes below all four moving averages
Advantages and disadvantages of the strategy

Advantages:
  • The strategy works well in trends, allowing you to profit from strong and sustained movements
  • The potential profit can be several times greater than the potential loss
Disadvantages:
  • As this strategy gives unprofitable signals during a flat period, it is better not to use it in a flat period
  • Moving signals can be slightly delayed, so a significant amount of profit can be lost on sharp market reversals
Read more at R Blog - RoboForex

Sincerely,
RoboForex team
 
RoboForex adds the Performance Fee scheme for CopyFX to the R StocksTrader app


Dear Clients and Partners,

Here we come with a long-awaited CopyFX update on R StocksTrader: RoboForex added a new possibility for the CopyFX Traders to earn commission from their subscribers - the Performance fee.

The Performance Fee

is a commission scheme in CopyFX which allows Traders to get the share of the total amount of profit made by their subscribed Investors, so the more your subscribers earn from their copied deals - the more commission you get.

This scheme mostly suits experienced and confident Traders who demonstrate a stable performance in the medium and long run.


Why do Traders choose CopyFX in R StocksTrader?

Minimal investments
Minimal deposit of 100 USD.

High order execution speed at the same price
Instant copying of transactions with the same execution price for the Trader and the Investor guaranteed.

Comfortable app
Trade in R StocksTrader any time from any place and make a profit on commissions.

1,500+ instruments for copying
Take advantage of this unique opportunity and offer Investors more than 1,500 instruments to copy.

Copy trading is proven popular among our clients and partners. We are, therefore, constantly developing our products, enhancing them, and introducing new functions to both the desktop and mobile versions of the platform. Stay tuned for the next update!


Become a CopyFX trader in R StocksTrader now
and embrace all the benefits!


Learn more about copy trading

Sincerely,
RoboForex team
 
How To Trade the On Neck Candlestick Pattern

Author : Victor Gryazin


Dear Clients and Partners,

In this review, we will get acquainted with the trend continuation candlestick pattern called "On Neck”. We will look at the features of its formation and the trading rules for its application. We will learn its main advantages and disadvantages, and also list a few important recommendations for its use.

How the On Neck pattern is formed

The "On Neck" candlestick pattern is a pattern that indicates a further continuation of the current trend. It is rarely seen on price charts. It consists of two candlesticks: the first has a large body pointing in the direction of the current trend, and the second has a small body. They are always of different colours: if the first candlestick is white, the second is black, and vice versa.

The feature of this model is that the second candlestick opens with a gap in the direction of the trend and then closes the gap with its body. The closing prices of the two candlesticks should be about the same. The first candlestick symbolises the "body", the second one is the "head", and the line connecting them and passing through the closing prices is the "neck", hence the name of the pattern.

The appearance of a small black candlestick after a large white candlestick in an uptrend indicates that the "bulls" have met temporary resistance, and when overcoming it, will be able to continue to move upwards. The appearance of a small white candlestick after a large black one in a downtrend indicates temporary support, through which the "bears" are likely to continue the downward movement.

Bullish "On neck" pattern

This is formed during an uptrend when there is an active upward price movement. The first candlestick of the pattern (large white) appears first, and then the second candlestick opens with a gap upwards. The "bears", trying to seize the initiative, return the quotations to the closing price of the first candlestick. The second candlestick (small black) absorbs the gap with its body, with the closing prices of the two candlesticks approximately coinciding.

A bullish continuation of the "On neck" pattern is formed on the chart. We must now wait for confirmation that the "bulls" are still strong enough to overcome the temporary resistance of the "bears". A further rise in quotations above the high of the pattern’s second candlestick will confirm this. This upward movement will mean that the buyers are still very strong, and the uptrend is likely to continue.


How to buy using the bullish on neck pattern
  • During an uptrend, a bullish "On Neck" pattern is formed on the price chart
  • It is recommended to open a buy position when the price rises above the maximum of the second candlestick in the pattern (small black candlestick). Stop Loss is set at the low of the first candlestick (large white)
  • To set Take Profit, you can focus on significant support and resistance levels
How to sell using the bearish on neck pattern
  • During a downtrend, a bearish "On Neck" pattern is formed on the price chart
  • It is recommended to open a sell position after the price decreases below the low of the second candlestick in the pattern (small white). Stop Loss is set at the high of the first candlestick (big black candlestick)
  • To set Take Profit, you can focus on significant support and resistance levels
Recommendations for the use of the pattern in trading
  • The pattern should be formed in a pronounced upward or downward trend – it is not traded in a sideways trend
  • Wait for a confirmation – an update of the pattern’s high/low – before opening a trade
  • To increase efficiency, the model can be used in conjunction with technical analysis tools
  • It is best to use higher time frames, from H4 and above
  • It is necessary to follow the rules of risk management and place protective stop-loss orders
Read more at R Blog - RoboForex

Sincerely,
RoboForex team
 
False Breakouts on Financial Markets: How to Detect and Use?

Author : Andrey Goilov


Dear Clients and Partners,

Hi everyone, today I'm going to talk about false breakouts. In certain cases, it might be unclear to the trader whether there has happened a breakout of the resistance level and, hence, the bullish trend will continue. Such a breakout might be false so that the price will reverse quite soon and go in the opposite direction. In certain cases, such formations may provoke a full-scale reversal of the trend.

As a rule, such things happen at the moment of testing the support/resistance levels. This situation is similar to a reversal. However, it might be a test of a normal trendline, as well as the completion of such patterns of tech analysis as the Triangle or Head and Shoulders, when the price escapes the pattern and the falseness of such a breakout becomes questionable.

This type of breakouts pertains to chart analysis. If we are evaluating the chart without indicators, our evaluation will always be subjective to some extent. It is should be kept in mind that this is an integral part of chart analysis.

What is a false breakout?

In most cases, a false breakout is the "tail" of a Japanese candlestick, which means that the price tried to break the support level away but the sellers were not strong enough to secure themselves under this level. Then the price bounces and moves upwards. This might signify the strength of the buyers and forecast further growth.

Types of false breakouts

Larry Williams was one of the first experts to describe false breakouts. He singled out such a type as Specialists Trap. If the market is bullish, the pattern is formed at the breakout of the resistance level closing much higher than the resistance area. The minimum of the candlestick preceding the one with the breakout acts as a sort of a critical level here.


In the case of falling and breaking this level away, we should expect a market reversal and overall falling. Larry Williams thinks that here we can see the false breakout form when traders enter the market emotionally.

How to detect a false breakout?

Tech analysts give different hints on false breakouts of levels or trendlines. For example, a true breakout requires closing above the resistance level. If the close prices return under the level the breakout may be false, so no growth us to be expected here.

Also, there is a rule of 3% applicable to important levels and lines. It says that the prices must rise above the level by more than 3%.

Imagine we are watching good growth of the gold prices. The important support area is at the level of 1455. If this level is broken away we might speak about a potential reversal to a downtrend.

If we apply the rule of 3% here the price must fall below 1411 for the breakout to be true. A decline to 1450 and a return indicates a false breakout, after which the growth is likely to continue.


However, this rule is just an instrument that helps distinguish between true and false breakouts. Other traders add time filters or follow-up tests of the broken levels to avoid false breakouts.

How to use false breakouts?

Larry Williams points at the fact that it is impossible to know beforehand whether the level will be broken out or not. What is more, he insists on using our own methods of analysis to use false breakouts effectively. As we may see, when the market is growing and a reversal Double Top may form, it is likely that the breakout of the resistance level will be followed by a further decline of the price. So, if it looks like the pattern will form, no growth should be expected.

Conversely, if the market is falling and its structure reminds of a Double Bottom, one should not hurry to sell after a breakout. If the prices have managed to return inside the pattern soon after the breakout, a market reversal is likely to happen, so that the pattern will be executed.

Very often traders use the MACD indicator that shows divergences on the chart well. If at the moment of a breakout of an important level there forms a convergence or a divergence on the chart, the breakout is likely to be false and the market should be entered in the opposite direction.

Read more at R Blog - RoboForex

Sincerely,
RoboForex team
 
RoboForex: upcoming changes to the trading schedule in view of the Easter holidays


Dear Clients and Partners,

We are informing you that due to the Easter holidays in Europe and the US, there will be some changes to the trading schedule on Good Friday and Easter Monday.

This schedule is for informational purposes only and may be subject to further change.

MetaTrader 4 / MetaTrader 5 platforms

Schedule for trading on CFDs on the German index DE40Cash
  • 7 April 2023 – no trading
  • 10 April 2023 – no trading
  • 11 April 2023 – trading as usual
Schedule for trading on CFDs on the US indices (US30Cash, US500Cash, USTECHCash) and the Japanese index JP225Cash
  • 7 April 2023 – trading stops at 4:00 PM server time
  • 10 April 2023 – trading as usual
Schedule for trading on Metals (XAUUSD, XAGUSD) and CFDs on oil (Brent, WTI)
  • 7 April 2023 – no trading
  • 10 April 2023 – trading as usual
Schedule for trading on CFDs on US stocks
  • 7 April 2023 – no trading
  • 10 April 2023 – trading as usual
Schedule for trading on CFDs on US futures
  • 7 April 2023 – trading stops at 4:15 PM server time
  • 10 April 2023 – trading as usual
R StocksTrader platform

Schedule for trading on US Stocks, US ETFs, CFDs on US Stocks and ETFs
  • 7 April 2023 – no trading
  • 10 April 2023 – trading as usual
Schedule for trading on CFDs on US indices (US30, US500, NAS100)
  • 7 April 2023 – trading stops at 4:00 PM server time
  • 10 April 2023 – trading as usua
Schedule for trading on CFDs on the EU indices (GER40, UK100, FRA40, SPA35), the Australian index AUS200, and the Japanese index J225
  • 7 April 2023 – no trading
  • 10 April 2023 – no trading
  • 11 April 2023 – trading as usual
Schedule for trading on CFDs on EU Stocks
  • 7 April 2023 – no trading
  • 10 April 2023 – no trading
  • 11 April 2023 – trading as usual
Schedule for trading on CFDs on UK Stocks
  • 7 April 2023 – no trading
  • 10 April 2023 – no trading
  • 11 April 2023 – trading as usual
Schedule for trading on CFDs on US futures
  • 7 April 2023 – trading stops at 4:15 PM server time
  • 10 April 2023 – trading as usual
Schedule for trading on Metals (XAUUSD, XAGUSD) and CFDs on Crude Oil (BRENT.oil, WTI.oil)
  • 7 April 2023 – no trading
  • 10 April 2023 – trading as usual
cTrader platform

Schedule for trading on Metals (XAUUSD, XAGUSD)
  • 7 April 2023 – no trading
  • 10 April 2023 – trading as usual
Please take note of the above trading schedule changes when planning your trading activity.

* – This schedule is for informational purposes only and may be subject to further change.

Sincerely,
RoboForex team
 
How to Trade the Three Moving Averages + MACD Strategy

Autho : Victor Gryazin


Dear Clients and Partners,

In this article, we will look at a medium-term indicator trading strategy based on using three Moving Averages and MACD. We will learn how to set these indicators on the chart and apply them in trading.

How the Three Moving Averages + MACD strategy works

The "Three Moving Averages + MACD" strategy, as the name implies, is a trading system based on the combined use of trend indicators’ Moving Average (MA) and MACD (Moving Average Convergence/Divergence) oscillator signals. These are popular and in-demand tools, which are often used in various trading systems. To trade on the strategy, three exponential Moving Averages (EMA) with periods of 5, 15, and 50, and the MACD with parameters 12, 26, and 9 are applied to the chart.

The Moving Average has long been proven to be a simple and effective tool for trend following. In this strategy, the slow EMA (50) is used to identify the direction of the current trend and acts as a guide to limit risk, while the faster EMA (5) and EMA (15) are used to identify points to enter the market.

The MACD indicator belongs to the oscillator group. It helps to determine the trend direction, strength and duration, price range, and reversal levels and to receive trading signals. The MACD is used in this strategy to confirm the priority trading direction.

How this strategy works:
  • When the EMA (5) crosses the EMA (15) from bottom to top, there is a buy signal. The price chart should be above the EMA (50), and the MACD histogram should be in the positive zone (above 0)
  • When the EMA (5) crosses the EMA (15) from top to bottom, there is a signal to sell. The price chart should be below the EMA (50), and the MACD histogram should be in the negative zone (below 0)


How to use the strategy in trading

The Three Moving Averages + MACD strategy is primarily focused on the EUR/USD and GBP/USD currency pairs. Recommended chart timeframes - H4, D1. Recommended Take Profit (5 digits) for EUR/USD: H4 time frame - 1000 pips, D1 time frame - 2000 pips. Recommended Take Profit values (5-digit quotes) for GBP/USD: H4 time frame - 1250 pips, D1 time frame - 2500 pips. Stop Loss is set immediately after the EMA (50).

Three Moving Averages + MACD Buy Signal
  • Prices begin to rise, EMA (5) crosses EMA (15) from bottom to top
  • The price chart is above the EMA (50)
  • The MACD histogram is in the positive zone (above 0)
  • A buy position is opened, and the Take Profit value is set according to the above recommendations
  • Stop Loss is set just below the EMA (50)
Three Moving Averages + MACD buying example
  • On 17 March 2023, on the H4 chart of the GBP/USD currency pair, the red EMA (5) crossed the blue EMA (15) from bottom to top
  • The price chart was above the green EMA (50) at this point
  • The MACD histogram was in the positive zone (above 0)
  • The buy position was opened at 1.21070, and Take Profit was set 1250 pips higher at 1.22320
  • Stop Loss was set just below the EMA (50), at 1.20500


Three Moving Averages + MACD Sell Signal
  • Quotes begin to decline, EMA (5) crosses EMA (15) from top to bottom
  • The price chart is below the EMA (50)
  • The MACD histogram is in the negative zone (below 0)
  • A sell position is opened, and the Take Profit value is set according to the above recommendations
  • Stop Loss is set just above the EMA (50)
Read more at R Blog - RoboForex

Sincerely,
RoboForex team
 
Situational Vs. Systematic Trading: Which One is More Efficient?

Author : Andrey Goilov


Dear Clients and Partners,

To be successful on financial markets, you need a neat trading system that will give you a clear understanding of how to enter and exit the market either with a profit or a loss. The rules of money management are also worth sticking to as they will psychologically prepare you for a series of losing trades as well as profitable ones.

Trading with a high-quality system is different from trading without one is also better in the sense that you do not need to think about whether the situation on the market is good enough to enter. You simply follow the rules and open or close trades, moving along the price chart.

Unfortunately, no one can tell if the current pattern will be executed or you will have to close it at the Stop Loss. To find out, you just have to trade the chosen method. Of course, you can use certain lifehacks and take measures to increase the probability of the execution of the signal, such as trading on a demo account until you receive two losing positions and only then moving to a real one. There are plenty of ways and methods of trading in the world, and every day millions of traders try to conquer the market.

In this article, we shall have a look at the pros and cons of both systematic and situational trading, discuss their differences, and speak about the practicability of each of them.

Systematic trading

Here, we are talking about a simple indicator-based system that will give the same signals to a dozen of different traders. As a rule, systematic trading does not allow for more than one opinion about the current market situation; the trader just needs to open a position and wait or to wait for a signal to enter the market.

In one of our posts, we spoke about the Ichimoku indicator. At first glance, it seems too complicated, but it boils down to trading the trend and waiting for the entrance signal to form. After that, we open a position and wait for the signals to form. For example, if the price breaks through the Ichimoku Cloud bottom-up, then you can buy.


If the price breaks through the Cloud top-down, the trend is likely to be descending, so you can sell. You do not need much time to make a decision, following the rules is enough.

Sure, in the times of a flat, you will be getting the breakaways all the time and either be opening and closing too many positions bringing no profit or suffering a series of insignificant losses. However, as soon as a trend begins, the market will be bringing the prices farther and farther from the entrance point. In such a case, you simply need to move the SL and hold the profit until the market reverses and closes your position.

Pros of trading along with the rules

It can often be heard that a good system is no more than 20% of success on the market while the remaining 80% is the ability to follow the rules of money management and stick to your own rules in the hard times, which will happen periodically.

As Victor Niederhoffer used to say: "In investments, as well as in life, the question is not whether you will be knocked down but when it will happen and whether you will manage to get up and keep fighting. The risk of failure is an essential part of human experience which is especially visible on financial markets dominated by speculation, which is the readiness to accept commercial risks".

A huge advantage of such an approach is the easiness of market analysis and decision-making. The lines have crossed — we sell, the lines have crossed back — we close the position and open a new one. If we hand the method to other traders, they will see the same crossings and will sell the same way due to the signal lines crossing. What is more, the trader feels less emotional pressure as he leaves decision-making to the system.

Pros and cons of situational trading

It must be admitted that an experienced trader can show a better result in trading graphic patterns than someone who has just seen a pattern and is trying to use it. In other words, experience is critical here. If you practice situational trading, you will have to think a lot and sometimes make hard decisions, which is lacking in the systematic approach to trading on financial markets.

So, analyzing charts regularly on different timeframes and sticking to your own rules of trading, sometimes postponing open positions due to low volatility, may be very hard in the long run. What should the trader choose?

How to choose an approach for a trader?

If the trader is new to the market, systematic trading by strict rules might be the best option. It will spare them from excessive market entries without good signals as well as decrease emotional pressure during a series of losing positions. In the process of trading, the beginner will be moving along the stages of a trader's development to the top where they can use their experience for situational trading, getting rid of some strict signals of the system that has shown the worst results.

We should not forget that a good system is just 20% of the overall result: you have to master risk control and feel confident suffering losses and locking in profit. A sports car will not make a racer out of an ordinary driver; same way, for situational trading you need experience and knowledge.

Read more at R Blog - RoboForex

Sincerely,
RoboForex team
 
What is Price Action Analysis?

Author : Timofey Zuev


Dear Clients and Partners,

Today we will talk about price action analysis, an important aspect of technical analysis on Forex. Price Action analyzes price behavior and patterns and can identify almost any market trend.

What is the subject of Price Action analysis, and how does it differ from graphic or indicator analysis?

The graphic analysis is meant to detect certain patterns on the chart that often reflect the interaction of demand and supply (buyers and sellers). For example, a Triangle, often emerging in the way of the trend, is normally a trend continuation pattern. In essence, a trader practicing graphic analysis need only to know this fact (that the Triangle is a trend continuation pattern) to make a decision. This simplifies analysis but creates additional limitations.

If the trader wants to figure out the reasons for the price movement, such an explication will not suffice – they need a more intricate understanding of market mechanisms. This need leads many traders to Price Action analysis.

Some say that Price Action analysis is just the analysis of simple candlestick patterns. Say, Rail or Pin Bar signal about an upcoming reversal, a breakaway of the inner bar signals to buy, etc.

In reality, such a simplistic approach to Price Action analysis will hardly be efficient: if you are eager to understand market processes from scratch, your analysis must become more complicated, not simpler. The number of details and factors that you must pay attention to will increase in a non-linear manner, and making decisions will become harder because the number of conflicting parts of the picture will grow (more signals and scenarios will appear for both buys and sales).

Of course, a trader does not need to see and understand everything: in the end, every market player chooses two or three trading styles and focuses on several types of events, such as breakaways of ranges or the appearance of trends two-three weeks long, etc. However, the understanding of Price Action frees the trader from a fixation on certain patterns – they start to operate principles and become able to find trading opportunities in virtually any market.

On the one hand, information becomes so plentiful that it needs filtration and specialization in a limited number of market situations; on the other hand, the abundance of information lets the trader see more in the market that forms no known-by-all pattern and gives no direct answers.

What does Price Action analysis consist of?

Understanding of patterns

A pattern is a figure on the chart that indicates some market process with a higher or lower probability. For example, if on the chart we see a candlestick with a large body and several other candlesticks that the first one incorporates, we may presume that the market is consolidating, and the following few hours, at least, the price will remain within the range. Why is this information helpful? For example, if we have decided to buy along with the trend, we should wait until the consolidation is over, or the price escapes the range. Similarly, we may see a 1-2-3 pattern that often indicates a beginning reversal.

However, just knowing the patterns is not enough: this alone will not give you any statistical advantage because the predictability of any financial market is quite low, no higher than 60% but normally lower. Forecasts seldom correlate with real events. Any forecast must be confirmed by price dynamics.

Watching price dynamics

This point is named like this for a reason: on history, charts look smooth and appealing, but in real-time, the market moves smoothly from point A to point B extremely rarely, if ever. Much more often, the market leaps abruptly in this or that direction, causing imbalance to traders. How could we use this information?

In fact, it is price dynamics that may indirectly indicate certain market processes. For example, increased aggressiveness and speed of market movements will most likely mean a lack of directed demand and supply (when the asset is accumulated for subsequent medium- and long-term positions) followed by a lack of a trend. A combination of sloppy price dynamics in consolidations with bolt-like breakaways in the direction of the trend will, on the contrary, most often indicate trend scenarios.

A bright example

Imagine an auction selling antiques. An auction house (best auction houses are usually English) puts something on sale for 1000 pounds but it turns out that no one wants to buy the thing for such a price. The auctioneer decreases it: 950 pounds, 900, 850, 800. AT last, a gentleman on the right is ready to buy. The auctioneer starts counting but an elderly lady offers 850 pounds. More and more participants get involved in the process, and the price soon overcomes 1000 pounds, where trading started, What has happened? Does the price not seem high anymore, or did auction players suddenly realize the value of the lot? In reality, the participants got involved in mass action, scared by rivalry or a probability to miss something important – anyways, the auction process has little in common with the real evaluation of a thing.

Read more at R Blog - RoboForex

Sincerely,
RoboForex team
 

Create an account or login to comment

You must be a member in order to leave a comment

Create account

Create an account on our community. It's easy!

Log in

Already have an account? Log in here.

Similar threads

Users Who Are Viewing This Thread (Total: 1, Members: 0, Guests: 1)

Top
AdBlock Detected

We get it, advertisements are annoying!

Sure, ad-blocking software does a great job at blocking ads, but it also blocks useful features of our website. For the best site experience please disable your AdBlocker.

I've Disabled AdBlock    No Thanks