What's new

Forex News Daily Analysis By FXGlory

4.70 star(s) 3 Votes
BTCUSD H4 Technical and Fundamental Analysis for 09.25.2025


BTCUSDH4_Technical_and_Fundamental_Analysis_For_2025-09-25-M.jpg


Time Zone: GMT +3
Time Frame: 4 Hours (H4)


Fundamental Analysis:

The BTC/USD currency pair is currently influenced by substantial economic data releases and events from the U.S., which may significantly impact market volatility. Today, various Federal Reserve officials, including Austan Goolsbee, Jeffrey Schmid, John Williams, Michelle Bowman, Michael Barr, Lorie Logan, and Mary Daly, are scheduled to speak. Their remarks regarding future monetary policy and economic outlook could affect the strength of the USD and, consequently, the BTC/USD pair. Key economic indicators including GDP, Jobless Claims, Durable Goods Orders, and Trade Balance will provide traders with essential insights into the overall health of the U.S. economy and currency strength.


Price Action:
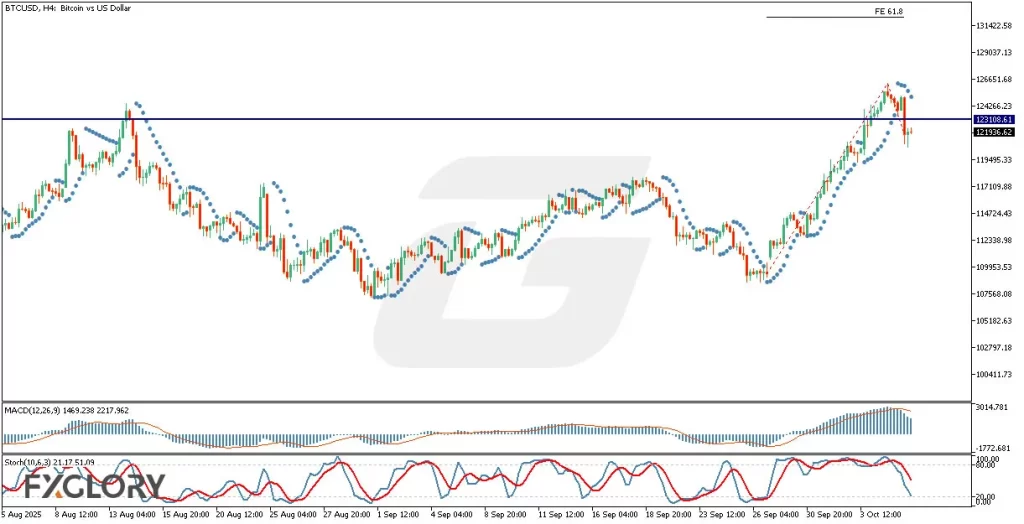
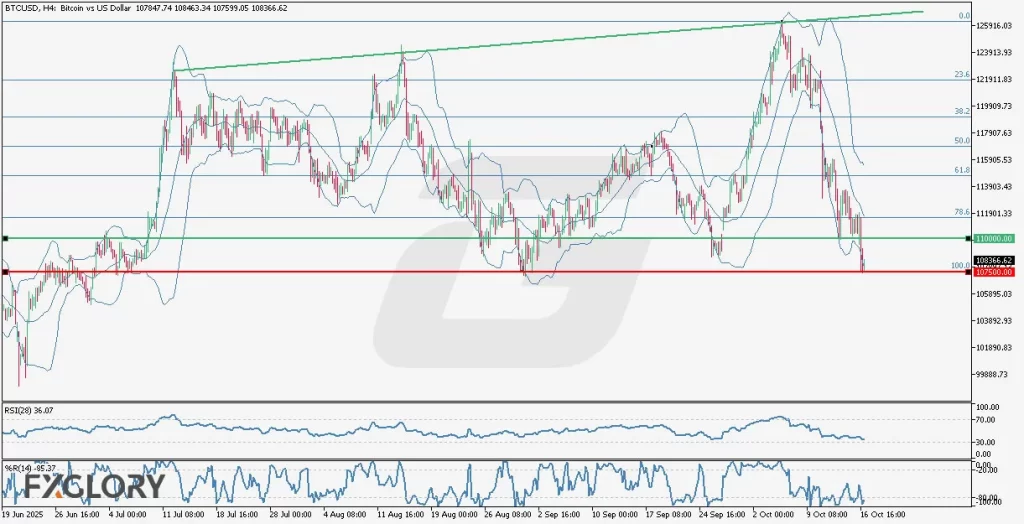
BTC-USD pair analysis on the H4 chart indicates a clear upward trend. Recently, BTCUSD reached a crucial support zone around 111,790, coinciding closely with an established ascending trend line. The price has successfully broken through the resistance line of the recent correction, suggesting a continuation of the bullish trend. Current price action indicates potential further upside, targeting the 117,600 level.


Key Technical Indicators:
EMA (240)
: The price is currently struggling around the EMA (240), serving as a dynamic resistance level. A confirmed break and close above this EMA could strengthen bullish sentiment.
RSI (28): Currently, the RSI is at 47.80, reflecting a neutral momentum environment. This indicates sufficient room for price appreciation before reaching overbought conditions, thus supporting potential upward movement.
MACD (12,26,9): The MACD histogram exhibits weakening bearish momentum, suggesting the possibility of an imminent bullish crossover. This potential shift signals increasing bullish pressure in the near term.
Parabolic SAR: Recent dots of the Parabolic SAR indicator are placed beneath the price candles, reaffirming the bullish sentiment and indicating a bullish trend continuation.


Support and Resistance:
Support:
Immediate and critical support lies around the 111,790 area, which aligns with the established ascending trend line.
Resistance: The primary resistance level to watch is at 117,600, representing the next key target for the ongoing bullish momentum.


Conclusion and Consideration:
BTC/USD on the H4 chart maintains a bullish outlook, supported by successful trendline testing and encouraging signals from technical indicators including EMA, RSI, MACD, and Parabolic SAR. Market participants should carefully monitor today's key U.S. economic events and Federal Reserve speeches, as any unexpected commentary or data could induce significant volatility and potentially influence short-term price action. Traders are advised to implement appropriate risk management strategies considering potential market fluctuations due to economic news.


Disclaimer: The analysis provided for BTC/USD is for informational purposes only and does not constitute investment advice. Traders are encouraged to perform their own analysis and research before making any trading decisions on BTCUSD. Market conditions can change quickly, so staying informed with the latest data is essential.


FXGlory
09.25.2025
 
USDJPY H4 Technical and Fundamental Analysis for 09.26.2025


Time Zone: GMT +3
Time Frame: 4 Hours (H4)


Fundamental Analysis:

The USD-JPY currency pair today faces a critical trading session with significant economic data releases from the US. Traders should closely monitor Personal Consumption Expenditures (PCE), Disposable Personal Income, and Consumer Spending reports, as better-than-forecasted results usually strengthen the USD. Additionally, speeches by Federal Reserve officials Thomas Barkin and Michelle Bowman could inject volatility depending on their commentary regarding inflation and interest rates. For JPY, traders anticipate Tokyo's Consumer Price Index (excluding fresh food) to provide early indications of Japan's inflationary trends, potentially influencing market sentiment towards JPY strength.


Price Action:
Technical analysis of the USD/JPY pair in the H4 timeframe shows a decisive bullish trend following a strong rebound from the lower boundary of an ascending channel. Currently, the pair is testing the middle channel line with strong bullish momentum, yet faces notable resistance around the 149.790 level, which could trigger a corrective phase before further upward attempts. Traders should watch closely for price rejection or breakout signals around this key resistance zone to confirm the next directional move.


Key Technical Indicators:
Bollinger Bands:
The price has breached the upper Bollinger Band significantly, indicating a possible short-term overextension and signaling potential corrective price action soon. A retracement toward the middle band may occur, providing traders with opportunities for entry.
RSI (14): Currently at 75.55, the RSI clearly indicates overbought conditions. This suggests a high probability of price retracement or consolidation before further bullish moves resume. Traders should be cautious of potential short-term reversals.
MACD (5,15,5): The MACD indicator remains positive with the MACD line notably above the signal line, accompanied by a rising histogram. This confirms robust bullish momentum; however, traders should monitor closely for any divergence as an early reversal sign.


Support and Resistance:
Support:
Immediate support lies at approximately 148.600, coinciding with the ascending channel’s middle line and the upper Bollinger Band breakout point. Further support can be found at 147.850 near recent price consolidation areas.
Resistance: A significant resistance barrier exists around the 149.790 level, aligning with previous highs and major price reaction points. A decisive breakout above this level could target the channel’s upper boundary at approximately 150.400.


Conclusion and Consideration:
The USD-JPY H4 analysis indicates strong bullish momentum reinforced by Bollinger Bands breakout, high RSI readings, and positive MACD signals. However, the pair’s overbought conditions and key resistance at 149.790 could trigger short-term corrections. Traders should remain alert to today's critical US economic reports and Fed speeches, which may significantly influence USD volatility. Moreover, Tokyo's CPI release could affect JPY strength, creating additional trading opportunities.


Disclaimer: The analysis provided for USD/JPY is for informational purposes only and does not constitute investment advice. Traders are encouraged to perform their own analysis and research before making any trading decisions on USDJPY. Market conditions can change quickly, so staying informed with the latest data is essential.


FXGlory
09.26.2025
 
GOLD H4 Technical and Fundamental Analysis for 09.29.2025


Time Zone: GMT +3
Time Frame: 4 Hours (H4)


Fundamental Analysis:

The XAUUSD pair is poised for potential volatility today due to significant news releases related to the US Dollar. Several Federal Reserve officials, including Christopher Waller, Beth Hammack, Alberto Musalem, and John Williams, are scheduled to speak at various conferences and events. Hawkish remarks from these FOMC members regarding future interest rate hikes could strengthen the USD, placing downward pressure on gold prices. Additionally, the release of Pending Home Sales data could further influence USD strength depending on actual versus forecasted figures, impacting GOLD/USD price action.


Price Action:
Analyzing GOLD in the H4 timeframe reveals a clear ascending channel, with the price approaching the upper boundary of this channel. The price has currently breached the Fibonacci 23.6% retracement level, and bullish momentum could potentially drive it towards the Fibonacci 50% and 61.8% levels. Price remains above the 100-period moving average, indicating sustained bullish strength, though caution is warranted near channel resistance.


Key Technical Indicators:
Moving Average (100): The price remains well above the 100-period moving average, emphasizing bullish sentiment. As long as this dynamic support holds, further upward momentum is possible.
RSI (28): The Relative Strength Index currently stands at 59.18, signaling moderate bullish momentum with room for further upside before reaching overbought conditions. Traders should watch RSI for signs of overextension near channel resistance.
MACD (24,52,18): The MACD line at 28.392 remains below the signal line at 33.310 but shows diminishing bearish divergence. This suggests a cautious bullish outlook as momentum gradually strengthens, though traders should monitor closely for any potential bearish crossovers.
Stochastic (5,3,3): The Stochastic oscillator at 68.65 and 75.13 is nearing the overbought threshold at 80, indicating that upward momentum could soon face resistance. A crossover above the 80-level would signal increased caution for a possible price correction.


Support and Resistance:
Support:
Immediate support levels are identified at 3690.00 (100-period moving average), followed by 3640.00 (lower boundary of the ascending channel and recent consolidation).
Resistance: Key resistance is observed at the channel's upper boundary near 3765.00 (Fibonacci 23.6%), with further levels at Fibonacci 50% and 61.8%, around 3820.00 and 3870.00, respectively.


Conclusion and Consideration:
Technical indicators and current price action suggest continued bullish momentum for XAU/USD on the H4 timeframe. However, given the proximity to critical resistance levels and upcoming USD-related news, traders should anticipate heightened volatility. Careful monitoring of the RSI, MACD, and Stochastic indicators is essential to identify early signs of reversal or continuation. Traders are advised to stay cautious and consider setting tight stop-losses due to potential sharp market reactions following Federal Reserve speakers' remarks and economic data releases.


Disclaimer: The analysis provided for XAU/USD is for informational purposes only and does not constitute investment advice. Traders are encouraged to perform their own analysis and research before making any trading decisions on XAUUSD. Market conditions can change quickly, so staying informed with the latest data is essential.


FXGlory
09.29.2025
 
EURJPY H4 Technical and Fundamental Analysis for 09.30.2025


EURJPYH4_Technical_and_Fundamental_Analysis_For_2025-09-30-M.jpg


Time Zone: GMT +3
Time Frame: 4 Hours (H4)


Fundamental Analysis:

Today, EUR-JPY traders should be attentive to several key economic indicators and events affecting the Euro and the Japanese Yen. For the Euro (EUR), Destatis and INSEE releases, including the Import Price Index, Real Retail Sales, and Consumer Price Index (CPI), will significantly influence market sentiment. Additionally, ECB President Christine Lagarde and Deutsche Bundesbank President Joachim Nagel are due to speak, with traders closely monitoring their speeches for hints on future monetary policy direction. On the Japanese Yen (JPY) side, upcoming releases from METI regarding Industrial Production and Retail Trade, alongside MLIT's data on Housing Starts, will provide essential indicators of Japan's economic health, potentially influencing the Yen's valuation.


Price Action:
The EUR/JPY pair demonstrates a bullish bias in the H4 timeframe. Price action shows an upward trend within a clearly defined ascending channel. Currently, EURJPY has reached the midline of the channel, and momentum appears moderate, suggesting a potential phase of consolidation or correction before resuming the uptrend towards the channel's upper boundary.


Key Technical Indicators:
EMA (55):
The 55-period Exponential Moving Average is positioned below the current price, acting as dynamic support, reinforcing the bullish sentiment. A break below the EMA would signal a possible reversal or deeper correction.
RSI (28): The RSI indicator currently stands at 51.14, indicating a neutral momentum state. There's ample room for price movements in either direction, supporting the potential for short-term consolidation or mild retracement before a further directional decision.
MACD (12,26,9): The MACD histogram is slightly positive, showing reduced bullish momentum. The MACD line is very close to the signal line, implying the market could enter a period of sideways trading or mild downward correction if momentum continues to weaken.


Support and Resistance:
Support:
Immediate support is located at approximately 173.00, aligning with recent consolidation zones and the EMA (55). Below this level, additional support is at 171.50.
Resistance: Immediate resistance stands at around 175.50, corresponding with recent swing highs. Further resistance is near the upper channel boundary at approximately 177.00.


Conclusion and Consideration:
EURJPY's technical analysis on the H4 chart indicates sustained bullish sentiment but also highlights a potential temporary consolidation or correction. While technical indicators like EMA (55) and the ascending channel favor the bulls, RSI neutrality and weakening MACD momentum signal caution. Given significant upcoming economic news and speeches affecting both EUR and JPY, traders should prepare for possible volatility spikes. Attention should be paid to key support and resistance levels to guide trading decisions effectively.


Disclaimer: The analysis provided for EUR/JPY is for informational purposes only and does not constitute investment advice. Traders are encouraged to perform their own analysis and research before making any trading decisions on EURJPY. Market conditions can change quickly, so staying informed with the latest data is essential.


FXGlory
09.30.2025
 
EURUSD H4 Technical and Fundamental Analysis for 10.01.2025


Time Zone: GMT +3
Time Frame: 4 Hours (H4)


Fundamental Analysis:

The EUR/USD pair today is influenced by a series of key Eurozone and U.S. economic releases. On the Euro side, the S&P Global Manufacturing PMI and the Eurostat Consumer Price Index (CPI) reports are in focus, both critical indicators of inflation and overall economic health in the Eurozone. A stronger-than-expected PMI above 50.0 or a higher CPI reading could provide bullish momentum for the Euro, as they would reinforce expectations for ECB policy tightening. Additionally, German Bund auctions and speeches from ECB officials, such as Bundesbank President Joachim Nagel, could provide further clues about monetary policy direction. On the U.S. side, the market awaits the ADP employment report, ISM Manufacturing PMI, and speeches from Federal Reserve members, all of which may increase USD volatility and weigh on EUR USD dynamics. Traders should expect heightened volatility during these releases as both currencies face competing fundamental drivers.


Price Action:
In the H4 timeframe, EURUSD is trading within a slight bullish trend channel, moving horizontally with a gradual upward slope. The pair is ranging between the upper and lower Bollinger Bands, having recently bounced from the lower band and climbed above the middle band. Currently, the candles are positioned in the upper half of the Bollinger Bands, supported by Parabolic SAR dots beneath the price, signaling a continuation of short-term bullish momentum. However, the market structure shows consolidation, and traders should monitor whether the pair can sustain momentum toward the upper channel line near resistance.


Key Technical Indicators:
Bollinger Bands:
The EURUSD price is moving within a narrow bullish channel, currently in the upper half of the Bollinger Bands. The latest bullish bounce from the lower band to the upper band around 1.1780 highlights ongoing buying pressure. If the price fails to break the upper band, sideways consolidation may follow.
Parabolic SAR (Step 0.02, Max 0.2): The latest Parabolic SAR dots (steelblue) are positioned below the candles, confirming short-term bullish sentiment. As long as the dots remain beneath the price action, upward momentum is likely to continue. A reversal would be signaled only if the dots shift above the candles.
RSI (14): The RSI is at 50.85, hovering around the neutral zone. This indicates that the EUR/USD is neither overbought nor oversold, leaving room for movement in either direction. A sustained push above 60 would confirm stronger bullish momentum, while a drop below 45 could suggest renewed bearish pressure.
MACD (12,26,9): The MACD shows values at 0.000040 and -0.000551, reflecting weak momentum with the lines converging. This signals a potential shift in momentum—either a continuation of the current sideways range or the early stage of a breakout. A bullish crossover would support upside continuation.
Williams %R (14): The Williams %R is at -30.29, close to the overbought threshold. This suggests that buying pressure has been dominant in the short term, but the market may soon face resistance if momentum does not strengthen further.


Support and Resistance:
Support:
The first support is at 1.1720, followed by 1.1660, and deeper support lies at 1.1600.
Resistance: The immediate resistance is at the upper Bollinger Band near 1.1780, while the next level is around 1.1820, aligned with the channel’s upper boundary.


Conclusion and Consideration:
The EUR-USD H4 chart shows the pair trading in a slight bullish trend channel, with technical indicators pointing toward mild bullish bias but with signs of consolidation. The RSI and Bollinger Bands suggest cautious optimism, while the MACD highlights weak but potentially strengthening momentum. Traders should monitor upcoming Eurozone CPI, PMI data, and U.S. employment figures, as these events may serve as catalysts for a breakout from the current consolidation range. Given the balanced technical outlook and high-impact news on both sides, EUR USD traders should prepare for potential volatility spikes.


Disclaimer: The analysis provided for EUR/USD is for informational purposes only and does not constitute investment advice. Traders are encouraged to perform their own analysis and research before making any trading decisions on EURUSD. Market conditions can change quickly, so staying informed with the latest data is essential.


FXGlory
10.01.2025
 

Create an account or login to comment

You must be a member in order to leave a comment

Create account

Create an account on our community. It's easy!

Log in

Already have an account? Log in here.

Similar threads

Users Who Are Viewing This Thread (Total: 3, Members: 0, Guests: 3)

Top