What's new

General About FXOpen – FXOpen.com

4.40 star(s) 7 Votes
Changes to Australia Day Trading Hours


Dear Traders,
Due to the upcoming Australia Day celebrations on Tuesday, January 26th, 2021, you will experience the following change in the trading hours schedule:

Thursday, January 26th
  • Indices CFD:
    • Australia 200 (#AUS200) – trading starts at 08:10 AM (GMT +2).
All other financial instruments will be traded as usual.

Please consider these changes when planning your trading next week.
 
Changes to Australia Day Trading Hours


Dear Traders,
Due to the upcoming Australia Day celebrations on Tuesday, January 26th, 2021, you will experience the following change in the trading hours schedule:

Thursday, January 26th
  • Indices CFD:
  • Australia 200 (#AUS200) – trading starts at 08:10 AM (GMT +2).

All other financial instruments will be traded as usual.

Please consider these changes when planning your trading next week.

source
 
Litecoin and EOS – Bears are in control


LTC/USD

The price of Litecoin has been in a decline since Tuesday when it was sitting at $166.11 and made a downfall to $130 level today, which was a decrease of 21.74%. Now the price is being traded slightly higher but is still in a downward trajectory.


Looking at the hourly chart, you can see that the price made a breakout below the ascending channel that formed since the 11th of January when the price fell to the $112.33 area. From there a recovery was made all the way up above the $160 level but now another impulsive descending move has been seen which is most likely the continuation of the corrective decrease. If this is the three-wave corrective decline from the 10th of January the move to the downside would be expected to continue and surpass the prior low at $112 and could potentially continue all the way down to $82.9.

However, there is a possibility that this is going to be a triangle formation of the higher degree in which this three-wave move could be its first sub-wave. In that case, the price could make another significant recovery before this move to the $82.9 horizontal level. The price has found support at 0.236 Fib level at least a temporary one, so now we are going to see what happens as if it manages to stay up the recovery might come.

EOS/USD

From its Tuesday’s high at $2.926 the price of EOS has decreased by 12.18% as it came down to $2.579 at its lowest wick today. Now the price is looking like it has stabilized above the $2.62 level and is establishing support.


On the hourly chart, you can see that the price has made a breakout from the ascending channel like in the case of Litecoin but the pattern isn’t as similar as the price of EOS made a more significant decrease from the 10th of January till the 11th then it has now since Tuesday. We have seen a decrease of over 37% till the 11th of January and if this descending move is the continuation of that move, the price could be expected to go significantly lower. But another round of hard-selling like it occurred then isn’t likely to play out.

More likely we are going to see a further decrease to some of the horizontal support levels out of which the first one in line would be the 11th January low, but the next one is just below the $2 mark. The price could make another impulsive move to the vicinity of the lower horizontal level, but like in the case of Litecoin that might not come in a straight line.
 
AUD/USD and NZD/USD Approaching Next Key Break


AUD/USD is trading well above 0.7700, but is facing hurdles near 0.7780 and 0.7800. NZD/USD is also showing positive signs, but there is a crucial resistance forming near 0.7225-0.7240.

Important Takeaways for AUD/USD and NZD/USD

  • The Aussie Dollar started a fresh increase above the 0.7720 resistance levels against the US Dollar.
  • There is a major contracting triangle forming with support near 0.7740 on the hourly chart of AUD/USD.
  • NZD/USD also climbed higher, but it is facing a strong resistance near 0.7225 and 0.7240.
  • A key bullish trend line is forming with support near 0.7185 on the hourly chart of NZD/USD.

AUD/USD Technical Analysis

After forming a support base near 0.7660, the Aussie Dollar started a fresh increase against the US Dollar. The AUD/USD pair broke the 0.7700 resistance level to move into a positive zone.

The pair even broke the 0.7720 resistance and settled above the 50 hourly simple moving average. A high is formed near 0.7782 on FXOpen and the pair is currently correcting lower.


There was a break below the 0.7760 support level. The pair even traded below the 50% Fib retracement level of the upward move from the 0.7720 swing low to 0.7782 high. It is now testing the 0.7745 support level and the 50 hourly simple moving average.

There is also a major contracting triangle forming with support near 0.7740 on the hourly chart of AUD/USD. The triangle support is close to the 61.8% Fib retracement level of the upward move from the 0.7720 swing low to 0.7782 high.

If there is a downside break below the triangle support, there is a risk of more losses. The next major support on the downside is near the 0.7720 level.

On the upside, the 0.7770 level is an immediate resistance. A clear break above the 0.7770 and 0.7780 levels may possibly open the doors for a larger increase towards 0.7800 and 0.7840 in the coming sessions.

NZD/USD Technical Analysis

The New Zealand Dollar also followed a similar path above the 0.7120 support against the US Dollar. The NZD/USD pair broke the 0.7200 resistance to move back into a positive zone.

However, the pair is facing a strong resistance near the 0.7225 and 0.7240 levels. A high is formed near 0.7225 and the pair is currently correcting lower. It traded below the 0.7200 level, but it is well above the 50 hourly simple moving average.


It is trading just below the 50% Fib retracement level of the upward move from the 0.7177 swing low to 0.7225 high. On the downside, there is a key bullish trend line forming with support near 0.7185 on the hourly chart of NZD/USD.

The trend line is close to the 76.4% Fib retracement level of the upward move from the 0.7177 swing low to 0.7225 high. If there is a downside break below the trend line support, there is a risk of more losses towards the 0.7150 and 0.7120 support levels.

Conversely, the pair could remain well bid above the 0.7180 support zone. On the upside, the 0.7225 and 0.7240 levels are crucial hurdles. A clear break and close above the 0.7240 level could set the pace for a strong increase towards the 0.7300 level.
 
TickTrader Trading Platform


TickTrader is a brand-new trading platform, which allows clients to trade five of the most popular asset classes — forex, stocks, commodities, indices, and cryptocurrencies via one trading account. A special trading account, TickTrader ECN, has been designed for trading using TickTrader platform.

As a trading platform, TickTrader pursues one goal: helping users to become profitable. It is easy to adopt and use, but besides being user-friendly, TickTrader boasts comprehensive functionality that ensures it meets the multitude of requirements from every type of trader, from beginner to institutional.

TickTrader Key Features

  • TickTrader Terminals. Use TickTrader Desktop Terminal, or install the special version of TickTrader Mobile Terminal on your iOS or Android device, or trade direct from any browser via TickTrader Web Terminal.
  • Highly customizable user-friendly interface. Personalize each single panel settings as well as the whole workstation entirely: a trader can easily create trading layout using a wide range of options and preferences.
  • Advanced technical analysis tools. Take full advantage of ready-made various traditional indicators or make your own and add them to your account.
  • One/double click trading mode. This tool is designed for traders who are looking to make profits of rapidly moving markets, or want to try high-frequency trading and/ or scalping and do not intend to lose a second on waiting. The orders are placed immediately.
  • Level 2 pricing. Venture the market depth with up to 200 levels and the ability to see your limit orders inside the order book.
  • Trading alert system. Customize your alerts and then choose how you receive the notifications.
  • Detailed charting system. Descriptive charts allow a trader to draw and see volumes, trades, and set up alerts.
  • Strategy back tester. Test and evaluate your trading strategies using past pricing and liquidity. You can then use the analytics to run your algo-trading strategies and EAs.

What TickTrader has to offer?

Now you can manage both margin and deliverable trading directly through the platform or via a FIX, REST, or WebSocket API. You can also fully adjust your workspace to suit your needs — a new intuitive user interface and more than 1200 advanced trading tools deliver a fully customizable trading experience. Level 2 data, heat maps, and backtesting are just some of the extensive trading tools offering sophisticated data analysis on the TickTrader platform, designed to help FXOpen clients create successful trading strategies.

You can also make use of all the opportunities offered by advanced order types — Market orders, Limit Orders, and Stop Orders. There are also several advanced settings for these order types the platform has to offer: volume units (lot or quantity), stop levels, and slippage settings.


FXOpen Company News
 
GBP/USD and EUR/GBP: British Pound Remains Strong


GBP/USD extended its rise above the 1.3680 and 1.3700 resistance levels. EUR/GBP is correcting lower and it is approaching a major support near 0.8875.

Important Takeaways for GBP/USD and EUR/GBP

  • The British Pound remained well bid above 1.3600 and it climbed above 1.3680.
  • There is a key contracting triangle forming with resistance near 1.3715 on the hourly chart of GBP/USD.
  • EUR/GBP started a fresh decline after it failed to clear the main 0.8920 resistance zone.
  • Earlier, there was a break above a short-term bearish trend line with resistance near 0.0.8860 on the hourly chart.

GBP/USD Technical Analysis

After forming a base above the 1.3500 and 1.3520, there was a fresh increase in the British Pound against the US Dollar. The GBP/USD pair broke the 1.3580 and 1.3600 resistance levels to move into a positive zone.

The pair gained momentum above 1.3600 and it even spiked above the 1.3680 resistance. There was also a break above the 1.3700 zone and the pair settled above the 50 hourly simple moving average.

A new multi-month high was formed near 1.3746 on FXOpen before the pair started a downside correction. It traded below the 1.3680 support level and the 50 hourly simple moving average, but the bulls protected the 1.3640 level.


A low is formed near 1.3636 and the pair is currently rising. It is trading above the 1.3680 level, the 50 hourly simple moving average, and the 50% Fib retracement level of the downward move from the 1.3746 high to 1.3636 low.

It seems like there is a key contracting triangle forming with resistance near 1.3715 on the hourly chart of GBP/USD. An immediate resistance is near the 1.3700 zone or the 61.8% Fib retracement level of the downward move from the 1.3746 high to 1.3636 low.

A successful break above the 1.3700 and 1.3715 levels could open the doors for a new high above the 1.3746 in the near term. Conversely, the pair could break the triangle support and continue lower towards the main 1.3620 support level.

EUR/GBP Technical Analysis

The Euro started a fresh increase from the 0.8830 low against the British Pound. The EUR/GBP pair broke the 0.8850 and 0.8860 resistance levels to move into a positive zone.

There was also a break above a short-term bearish trend line with resistance near 0.0.8860 on the hourly chart. The pair surged above the 0.8900 level, but it struggled to clear a major hurdle near the 0.8920 zone.


A high is formed near 0.8918 and the pair is currently declining. It broke the 0.8900 level and tested the 38.2% Fib retracement level of the upward move from the 0.8830 swing low to 0.8918 high.

On the downside, there is a major support waiting near the 0.8875 level and the 50 hourly simple moving average. It is also close to the 50% Fib retracement level of the upward move from the 0.8830 swing low to 0.8918 high.

Any more losses could lead the pair towards the 0.8850 support level in the near term. Conversely, the pair could start a fresh increase from the 0.8875 support zone.

On the upside, the 0.8900 level is a short-term resistance for the Euro bulls. However, the main hurdle is still near 0.8920, above which EUR/GBP could rally towards the 0.9000 resistance.
 
Decisive Week for the Dollar as the Fed’s Meeting Looms Large


Financial markets started the new year on the same note as the previous year ended – higher stocks, lower dollar. The extent of the advance in the stock market, or the decline in the dollar, led many market participants to wonder if the Fed’s monetary policy did not lead to financial bubbles?

After all, a survey shows that over 25% of the market participants still believe that Bitcoin will double from the current levels. Or, 18% believe that the price of Tesla will double over the next twelve months. That is, in the context of Bitcoin already rising from $10,000 to $40,000 in the last months and Tesla already being up over 650% in 2020.


Will the Dollar Weakness Stop?

To many, the weakness in the dollar is responsible for such extreme price action. If we are to see a change in the trend, as suggested by the 56% of the market participants that expect a higher dollar against Bitcoin for the next twelve months, then the risk may come from Wednesday Fed’s decision.

On Wednesday, the Fed is expected to keep the monetary policy unchanged – the federal funds rate at the lower boundary and the QE program running at $120 billion/month. However, this week, the focus will shift from the FOMC Statement to the Fed’s press conference.

More precisely, it will be more important what the Fed thinks about the future economic outlook. In the face of the rapid pace of vaccinations (i.e., the United States already vaccinated 6% of its population), the risk is that the Fed will deliver a slightly hawkish outlook for the future economic recovery. If that is the case, the dollar may turn in the expectation of the future tapering of the quantitative easing program.

Last week the ECB delivered a slightly hawkish statement too. It said that it may or may not use the full envelope of the PEPP program, despite the fact that many European countries face the worse of the pandemic right now.

As such, one should not discount a hawkish Fed too. If that happens, the USD will make a U-turn because the reflation trade that went on for months now seems to be extremely stretched.

As we saw in 2020, the dollar’s direction matters for the equity markets and other markets too. For stocks to remain close to all-time highs, the correlation with the dollar must break.

Will we see such a divergence on Wednesday? Or will the reflation trade continue after the Fed’s first meeting of the year?
 
ForexCup Trading Championship 2021, a contest for traders to win $50,000, is now live!


FXOpen, a trusted global CFD and Forex broker is proud to announce the launch of the ForexCup Trading Championship 2021. The contest with the main prize of $50,000 runs from January 1 to December 31, 2021, and is available to all traders with active FXOpen accounts.

The ForexCup Trading Championship is a one-of-a-kind contest designed to engage investors, traders, and portfolio managers in fair and reliable global competition. For an entire year, participants will compete for the title of the best and for a hefty cash prize of 50,000 U.S. dollars, which will go to whoever demonstrates the most profit at the end of the year 2021.

  • The contest is available to anyone who has an active FXOpen ECN account. The only requirement is to have a minimum trading deposit and follow the contest rules.
  • Participants can choose any instruments available within their jurisdictions: spot FX, Index, Commodity, Stock, Metal or Crypto CFDs.
  • Three personalized crystal trophies are prepared for the first three places, and the trader who takes the first place will receive a cash prize of $50,000 without any additional conditions.

Forex Trading Championship is a brand-new name among other trading competitions, but it has a big legacy. With the support of renowned partners, including global Forex and ECN broker FXOpen, the championship provides an opportunity for you to compete with the best and put your trading strategies to the test!

“We launched the ForexCup Trading Championship to provide our clients the unique opportunity to test not only themselves but to measure and compare their trading skills against their peers, to take the coveted position of Top Trader. Ultimately, we hope this will identify and inspire the next generation of Forex enthusiasts,” Gary Thomson asserts, the Chief Operating Officer of FXOpen UK.

Anyone interested can sign up now or read more about Forex Trading Championship rules and philosophy here[/B].

FXOpen Company News
 
BTC and XRP – Bearish scenario expected


BTC/USD

From yesterday’s open the price of Bitcoin has increased by 12.44% coming from its lowest point of $31,030 to $34,891 at its highest but has since then made a downfall. The price fell back to the same levels as on yesterday’s low and is now starting to make another recovery attempt. Currently it is sitting at around $32,221.


Looking at the hourly chart, you can see that the price made a recovery from the 22nd of January when it fell to $28,785 at its lowest wick. The decrease to those levels was the completion of the 3rd wave from the corrective structure that started developing after the all-time high.

We could have seen the completion of the correction, but the wave structure is still looking more corrective than impulsive on the recovery that followed. This is why more likely, we are seeing the corrective wave continuation in the form of the second wave X from the WXYXZ complex count.

As you can see the price made a descending triangle from its all-time high and since it made interaction with its resistance level, now we are going to have a validation of the assumed scenario as if the price is in a prolonged correction now the Z wave is shortly going to start developing. That means that now a breakout to the downside would be shortly expected.

If this starts developing the price of Bitcoin could fall back to the $24,000 area where the next significant horizontal support level in line with the downside. This would be a downfall of just over 30% which would be a highly significant one.

XRP/USD

The price of Ripple has been moving sideways from the 22nd of January when it spiked down to $0.24 area from where it made a recovery to $0.28 level. Since the price has been in this horizontal range we have seen further support and resistance testing with the price currently sitting at $0.26645.


As you can see from the hourly chart, the price has previously made a breakout to the upside from the descending triangle in which it was since the 8th of January but failed to continue moving to the upside. The assumed scenario was the five-wave impulse to the upside but since the price spiked inside the territory of the 1st wave this is starting to get invalidated. Instead, more likely we have seen a three-wave upside corrective move before further downside continuation.

However, the quick spike on the 22nd could have been the completion of the 4th wave although unlikely at this point. In the upcoming period, we are going to see if the invalidation gets confirmed and that is going to be indicated from the breakout direction of the current horizontal range.
 
EUR/USD and EUR/JPY: Euro Eyeing Upside Break


EUR/USD is holding the 1.2100 support area, but it is also struggling to clear 1.2200. Similarly, EUR/JPY is facing a strong resistance near 126.15, above which it could start a strong increase.

Important Takeaways for EUR/USD and EUR/JPY

  • The Euro is consolidating in a range above the 1.2100 support zone.
  • There is a major contracting triangle forming with resistance near 1.2170 on the hourly chart of EUR/USD.
  • EUR/JPY is facing a major resistance near the 126.15 and 1.2620 levels.
  • There is a key contracting triangle forming with resistance near 126.15 on the hourly chart.

EUR/USD Technical Analysis

This past week, the Euro climbed above the 1.2150 resistance zone against the US Dollar. However, the EUR/USD pair faced a major resistance near the 1.2200 and 1.2210 levels.

There were a couple of attempts to clear 1.2200, but the bulls failed to gain strength. As a result, there was a sharp decline below 1.2150. The pair broke the 1.2120 support, but it found a strong support near 1.2100.


A low was formed near 1.2107 before the pair bounced back to 1.2175. A high is formed near 1.2175 on FXOpen and it is currently correcting lower.

The pair is testing the 23.6% Fib retracement level of the recent wave from the 1.2107 swing low to 1.2175 high. The first major support on the downside is near the 1.2150 level and the 50 hourly simple moving average.

The next major support is near the 1.2140 level. It is close to the 50% Fib retracement level of the recent wave from the 1.2107 swing low to 1.2175 high. On the upside, an immediate resistance is near the 1.2175 level.

There is also a major contracting triangle forming with resistance near 1.2170 on the hourly chart of EUR/USD. A clear break above the triangle resistance could push the pair towards the main 1.2200 resistance zone.

If EUR/USD clears the 1.2200 resistance zone, there could be a strong increase. In the stated case, the pair could easily rise towards 1.2250 or 1.2265.

EUR/JPY Technical Analysis

The Euro also followed a similar path after it faced seller near 1.2640 against the Japanese Yen. The EUR/JPY pair broke the 126.00 support level, but it remained stable above the 125.70 level.

A low is formed near 125.69 and the pair is currently rising. There was a clear break above the 126.00 level and the 50 hourly simple moving average. The pair also climbed above the 50% Fib retracement level of the recent decline from the 126.39 high to 125.69 low.


It is now facing resistance near the 126.12 level. It represents the 61.8% Fib retracement level of the recent decline from the 126.39 high to 125.69 low.

There is also a key contracting triangle forming with resistance near 126.15 on the hourly chart. A clear break above the triangle resistance and 126.20 could open the doors for more upsides. The next major resistance is near 126.40, above which the bulls might aim a test of the 127.00 level.

Conversely, the pair could drop below the 126.00 level and the 50 hourly SMA. In the stated case, it could test the triangle support at 125.90. Any more losses could open the doors for a drop towards the 125.50 level in the near term.
 
Guess the currency rate and get money!


We are continuing a series of contests among our subscribers.

This week we will give away $50 to those, who will provide the closest forecast for the XTI/USD pair.

Full Details about the Contest on the FXOpen official page Facebook
 
LTC and EOS – Correction might have ended but downside potential still present


LTC/USD

The price of Litecoin has been on the rise since yesterday as it came from $118.1 to $132.15 which is an increase of 11.89%. Now it is being traded slightly lower but is still in an upward trajectory.


On the hourly chart, we can see that this recovery came after a decline of around 20.35% from its high on January 25th when it reached $147.8. This was the continuation of the descending move that started on the 7th of January and is part of the corrective structure of a higher degree count. The price found support on the 0.618 Fib extension level and is now looking for support on the 0.5.

If the support is present on those levels we could see the recovery continuing to move to the upside. But if the price doesn’t find support further downside movement could be seen. In either way, since this is the part of the higher degree correction we would expect further downside as there is still more room to go. If the price is to make a five-wave impulse that could be the C wave of the ABC correction we could see Litecoin being traded at around $75 area. However, we could be seeing a different correctional count in which case projecting the length of the first descending impulse we come up with the target of around $91.35.

EOS/USD

From yesterday’s low at $2.465 the price of EOS has increased by 13.61% as it came up to the $2.801 level at its highest point today. The price spiked impulsively to the upside but has since made a minor retracement to the $2.7134 level where it’s currently being traded.


Looking at the hourly chart we can see that the price made a higher low yesterday and has attempted to make a higher high but failed to do so on the current rise. However, considering the impulsiveness seen this might change soon. From its high on the 10th of January made at $3.925 a strong descending move was made which could have been the starting point of the correctional higher degree move.

With the price currently testing the prior high which is the horizontal resistance, it might get rejected causing further downside continuation. In that case, we are to see an immediate retracement which will push the price further down breaking the horizontal support of $2.4237. But if it continues increasing from there it could indicate that the correction ended on the 22nd of January in which case yesterday’s low would be the 2nd wave out of the next five-wave impulse to the upside.
 
Gold Price Struggles, Oil Price Consolidates Well above $50


Gold price made an attempt to surpass the $1,860 resistance, but there was a major rejection. Crude oil price seems to be consolidating gains above $51.50 and $51.20.

Important Takeaways for Gold and Oil

  • Gold price is still trading below the main $1,860 and $1,880 resistance levels against the US Dollar.
  • There is a major bearish trend line forming with resistance near $1,855 on the hourly chart of gold.
  • Crude oil price seems to be facing a strong resistance near the $53.50 and $54.00 levels.
  • There is likely an expanding triangle forming with support near $52.00 on the hourly chart of XTI/USD.

Gold Price Technical Analysis

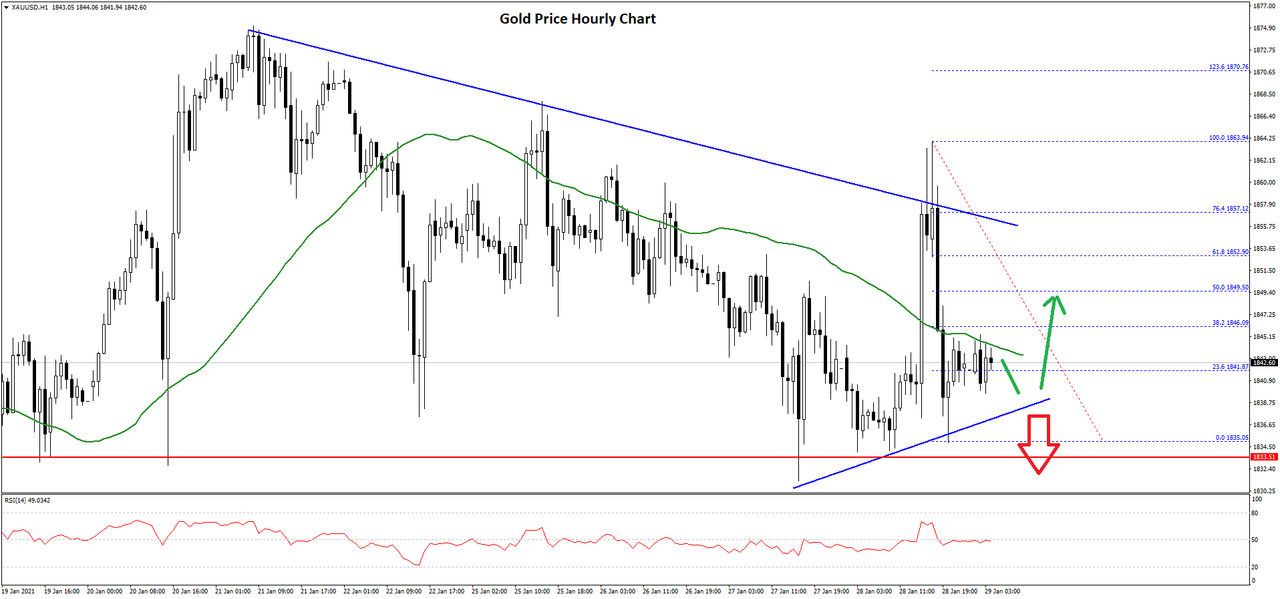
Gold price settled below the main $1,900 pivot level to move into a bearish zone against the US Dollar. The price even settled below the $1,880 level and the 50 hourly simple moving average.

On the downside, the price is finding strong bids above the $1,830 and $1,835 levels. Recently, there was a sharp recovery above the $1,850 level and the 50 hourly simple moving average. However, the price failed to clear the $1,860 resistance level.


A high was formed near $1,863 on FXOpen before there was a fresh decline. A low is formed near $1,835 and the price is currently consolidating losses.

There was a break above the 23.6% Fib retracement level of the downward move from the $1,863 swing high to $1,838 low. It is now facing resistance near the $1,845 level and the 50 hourly simple moving average.

The next major resistance is near the $1,850 level. The 50% Fib retracement level of the downward move from the $1,863 swing high to $1,838 low is at $1,850. There is also a major bearish trend line forming with resistance near $1,855 on the hourly chart of gold.

On the downside, there is a connecting bullish trend line forming with support near $1,838. The first key support is near the $1,830 level. The next major support is at $1,820, below which the price might test the $1,800 support level.

Oil Price Technical Analysis

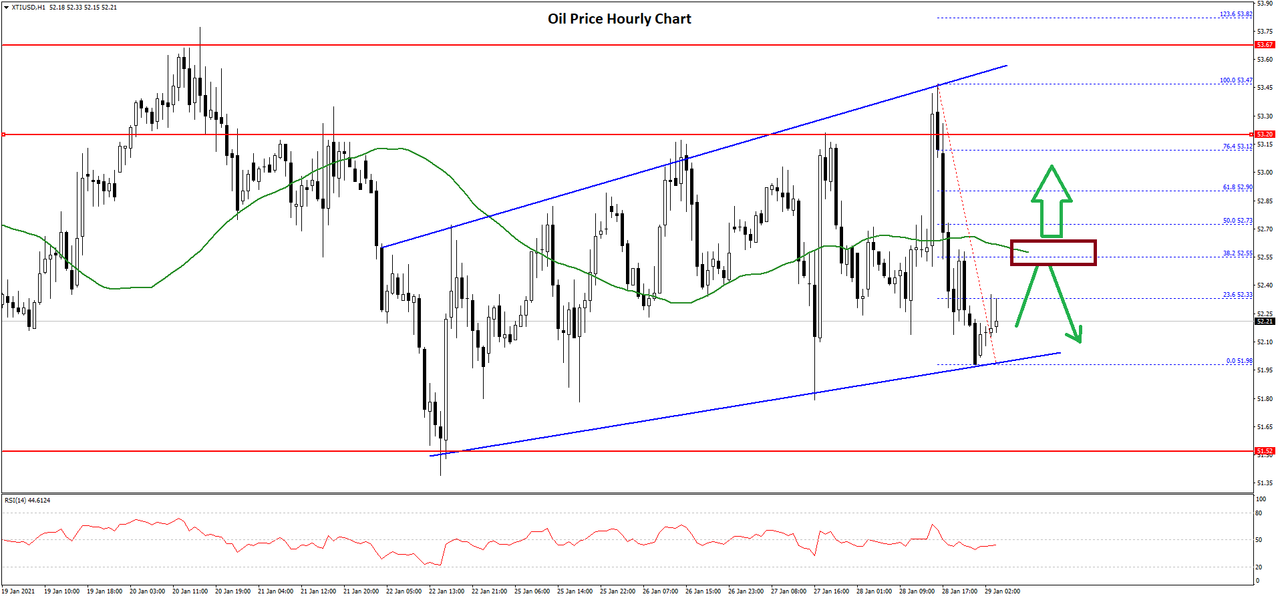
Crude oil price remained in a strong uptrend well above the $50.00 resistance zone against the US Dollar. The price settled nicely above $52.00 and it even made a few attempts to gain strength above the $54.00 level.

The recent high was formed near $53.47 before the price trimmed most gains. It broke the $53.00 support and tested the $52.00 level.


A low is formed near $51.98 and the price is currently consolidating. It tested the 23.6% Fib retracement level of the recent decline from the $53.47 high to $51.98 low. The first major resistance is near the $52.55 level and the 50 hourly simple moving average.

The next key resistance is near the $52.75 level or the 50% Fib retracement level of the recent decline from the $53.47 high to $51.98 low.

Moreover, it seems like there is likely an expanding triangle forming with support near $52.00 on the hourly chart of XTI/USD. If there are more downsides below the triangle support, the price could test the $51.50 support.

The next key support is near the $51.20 level. On the upside, the $53.50 and $54.00 levels are major hurdles. A clear break above $54.00 may possibly lead the price towards the $55.00 level.
 
How to start Forex trading?

Whether a currency is increasing or declining in value, there is always a way for you to make money in Forex

Consider a national currency as a security, like stocks, commodities or precious metals. The recipe for success is to buy it at the cheapest price and then sell at a higher price. Or the other way round – sell at a higher price and then buy cheaper. Whether a currency is increasing or declining in value, there is always a way for you to make money in Forex! Knowing the right time to buy or sell will do the trick. This is where market analytics, indicators, signals and automated trading systems come in handy.

Let's consider an example:
Currencies are traded in pairs. For example – Euro against US Dollar (EUR/USD) or British Pound against Japanese Yen (GBP/JPY). A Forex transaction involves buying one currency and selling the other currency at the same time.The exchange rate reflects the value of one currency against the another currency, For example, the quote USD/CHF 0,93160/0,93170 shows, how many Swiss Francs you need to pay to buy or sell 1 US Dollar. Currency exchange rates are always fluctuating depending on the time of the day, the country's central bank rate, government policy, market sentiment and many other reasons.

Let's assume the market forecast the Euro is going to appreciate against US Dollar (bullish trend for EUR/USD). You decide to buy Euros with USD (buy order on EUR/USD). After some time you decide to sell the Euro at a higher price (close the open EUR/USD position). Your profit is the difference between the opening and the closing prices.

How much money do you need to start trading Forex?
In order to attract traders, many forex brokers, including FXOpen, offer to start trading without a starting deposit. You can start trading with us without money from $10, which are credited to you as a welcome bonus to a newly opened active STP account after passing the verification.

Learn the basics of currency trading
Remember that Forex trading involves high risk. There are limitless opportunities to make profit and your potential gain is very high. However,the risk of loss is high as well. If you make an independent and informed choice to become a Forex trader, you should always follow the basic risk management rules. It's not an easy task but it's very important whether you trade with a few hundred dollars or operate millions.

Taking a good Forex education course may be the best investment you'd ever make in your trading career. Take your time to study the basics of trading and practice it in a demo account before you start trading with real money. Always be sure to follow the rule - never trade with money that you cannot afford to lose.

Sign up with FXOpen;
 
GBP/USD Facing Key Resistance, USD/CAD Remains Supported


GBP/USD gained momentum above the 1.3700 resistance, but it struggled near 1.3745. USD/CAD is holding the 1.2750 support, but it is struggling below 1.2820.

Important Takeaways for GBP/USD and USD/CAD

  • The British Pound is holding gains above the 1.3650 and 1.3680 levels.
  • There is a connecting bullish trend line forming with support near 1.3690 on the hourly chart of GBP/USD.
  • USD/CAD struggled to stay above 1.2820 and corrected lower.
  • There is a major bullish trend line forming with support near 1.2770 on the hourly chart.

GBP/USD Technical Analysis

After forming a base above the 1.3620 level, the British Pound started a fresh increase against the US Dollar. The GBP/USD pair broke the 1.3700 resistance level to move into a positive zone.

There was also a break above 1.3720 and the 50 hourly simple moving average. However, the pair seems to be facing a strong resistance near the 1.3745 and 1.3750 levels. The recent high was formed near 1.3751 on FXOpen before the pair corrected lower.


A low is formed near 1.3691 and the pair is currently rising. It broke the 50% Fib retracement level of the recent decline from the 1.3751 high to 1.3691 low.

On the upside, an initial resistance is near the 1.3738 level. It is close to the 76.4% Fib retracement level of the recent decline from the 1.3751 high to 1.3691 low. The main resistance is still near the 1.3750 zone.

To start a strong increase, the pair must clear the 1.3745 and 1.3750 resistance levels. If the bulls succeed, the pair could rise towards the 1.3850 level.

On the downside, the first key support is near the 1.3700 area. There is also a connecting bullish trend line forming with support near 1.3690 on the hourly chart of GBP/USD. If there is a break below 1.3700 and 1.3690, the pair could decline towards the 1.3620 support zone in the near term.

USD/CAD Technical Analysis

The US Dollar followed a bullish path above the 1.2800 level against the Canadian Dollar. The USD/CAD pair even broke the 1.2820 and 1.2850 resistance levels, but it struggled near the 1.2880 level.

There were two attempts by the bulls to clear 1.2880, but there was no upside break. A high was formed near 1.2874 and the pair decline below the 1.2820 support level. A low was formed near 1.2737 and the pair corrected higher.


It broke the 1.2800 resistance level, plus the 50% Fib retracement level of the downward move from the 1.2874 high to 1.2737 swing low. However, the pair faced a strong resistance near the 1.2820 level and the 50 hourly simple moving average.

It also failed to clear the 61.8% Fib retracement level of the downward move from the 1.2874 high to 1.2737 swing low. The pair is currently declining and trading near the 1.2780 level.

On the downside, there is a major bullish trend line forming with support near 1.2770 on the hourly chart. If USD/CAD breaks the trend line support, there is a risk of a larger decline in the coming sessions.

The next major support is near the 1.2700 level. On the upside, the first major resistance is near the 1.2820 level and the 50 hourly simple moving average. The next key resistance is near the 1.2880 level. A clear break above the 1.2820 resistance level may possibly increase the chances of a run above 1.2880 in the near term.
 
The USD Shows Signs of Strength Ahead of the NFP Report Next Friday


The trading week started on a strong note for the USD. The greenback gained against the Euro and the CHF, despite the fact that the Euro area manufacturing PMI came out way above the 50 level.

It appears that the weakness in the EURUSD pair, the most important pair as it weighs almost 50% in the dollar index, comes more from a weak Euro rather than from a strong dollar. Nevertheless, if the EURUSD pair keeps the bearish trend, the other dollar markets will eventually follow.


Two Central Banks to Release Their Decisions This Week

Last week we saw the Federal Reserve of the United States (Fed) announcing its interest rate decision. It left the monetary policy unchanged, and at the press conference Jerome Powell, the Fed’s chair, failed to guide markets as to what comes next. The focus was on forward guidance and on any hint from the Fed of a possible tapering of the quantitative easing program currently running at $120 billion ($80 billion asset purchasing and $40 billion mortgage-backed securities).

But the Fed chose to avoid the subject and thus, the markets moved forward. As the chart above shows, the Fed is not the one with the most aggressive balance sheet expansion. The Swiss National Bank (SNB) and the Bank of Japan (BOJ) lead the pack, followed by the European Central Bank (ECB) in the third place. The implications are that the Fed still has room to go, or that the dollar declined too much as if we compare the balance sheet of the four central banks, the dollar should be higher.

This week it is the Reserve Bank of Australia (RBA) and the Bank of England (BOE)’s turn to announce their policy. The British pound (GBP) has been on a strong recovery since the Brexit deal was announced in late December last year. Also, the Australian dollar (AUD) is one of the best-performing currencies during the health crisis.

As always, the first trading week of the month brings the NFP report on Friday. The focus on this week’s report is to see if the U.S. economy continues to lose jobs. If we see a reversal, fueled by the increased vaccination rate, the market may trade in anticipation of a stronger economic recovery than initially expected.
 
Trade Cryptocurrency with FXOpen - Crypto 10 Account

Dear Traders,

Trade Cryptocurrency with FXOpen - Crypto 10 Account, where you can access high leverage, low cost cryptocurrency trading from as little as $10.


Read Full on FXOpen Company News...
 
BTC and XRP – Corrections might have ended but further confirmation still needed


BTC/USD

The price of Bitcoins has been moving sideways in the last couple of days after it made a spike to the upside to $38,637 at its highest point. This increase of around 31.9% came after the price tested the descending triangles support level and was the impulsive move that made a breakout from the triangles on the upside.


As you can see from the hourly chart after a breakout was made the price fell back and retested the triangle’s resistance level for support, which was a pullback to $32,213. Support was present at those levels which is why we have seen further increase but the price didn’t manage to move back up for a higher high compared to the local one.

Even though the breakout was made this increase could still be part of the same correctional structure that started on the 10th of January after the all-time high was made. If this is true then the price is now headed further down for the formation of the Z wave of the complex correction count.

Another possibility would be that the correction ended on the 27th of January in which case this impulse was to be the first wave from the next starting impulse. As the price is now in a downward trajectory we are going to see which count gets validated. If the price continues moving down and enters the territory of the descending triangle then it would be the first bearish one, but if it finds support and continues increasing, further price appreciation would look more likely.

XRP/USD

The price of Ripple has spiked to the $0.755 level yesterday coming from $0.3895 at its lowest point on Sunday, which was an increase of 93.84%. But after the increase ended the price was set in a downfall of 54%, coming to $0.3465 at its lowest point today. Since then recovery has been seen with the price moving sharply to the upside and is currently being traded just slightly below the $0.4 level.


On the hourly chart, you can see that the price fell below the 0.618 Fibonacci level but now managed to pull back above it. The previous upside move was the ending of the five-wave impulse that started before the new year which is why we have seen a retracement. If this impulse was the first wave after the larger correction ended, the price of Ripple is now headed further to the upside but considering the amount of the decrease we have seen since yesterday we are yet to see if the bullish interest is still present.
 
EUR/USD Remains at Risk, USD/CHF Gains Bullish Momentum


EUR/USD failed to continue higher and declined below 1.2100. USD/CHF is gaining bullish momentum and it is trading nicely above 0.8900.

Important Takeaways for EUR/USD and USD/CHF

  • The Euro started a fresh decline below the 1.2120 and 1.2080 support levels against the US Dollar.
  • There is a key bearish trend line forming with resistance near 1.2065 on the hourly chart of EUR/USD.
  • USD/CHF started a strong increase and climbed above the 0.8900 resistance zone.
  • There is a short-term expanding triangle forming with support near 0.8950 on the hourly chart.

EUR/USD Technical Analysis

The Euro failed on many occasions to clear the 1.2200 resistance zone against the US Dollar. As a result, the EUR/USD pair started a fresh decline below the 1.2150 and 1.2120 support levels.

The pair even broke the 1.2080 support level and the 50 hourly simple moving average. It cleared the key 1.2055 support zone and traded as low as 1.2011 on FXOpen.


EUR/USD is currently correcting higher and trading above 1.2025. It is testing the 50% Fib retracement level of the recent decline from the 1.2086 high to 1.2011 low. On the upside, the first resistance is near the 1.2055 level and the 50 hourly simple moving average.

There is also a key bearish trend line forming with resistance near 1.2065 on the hourly chart of EUR/USD. The trend line is close to the 61.8% Fib retracement level of the recent decline from the 1.2086 high to 1.2011 low.

A successful break above the 1.2065 resistance and the 50 hourly simple moving average is must for a steady recovery in the near term.

Conversely, the pair could start a fresh decline from 1.2055. An initial support is near the 1.2025 level. The next major support is near the 1.2000 zone. Any more losses could lead the pair towards the 1.1950 zone.

USD/CHF Technical Analysis

The US Dollar started a steady increase from the 0.8850 support zone against the Swiss franc. The USD/CHF pair broke many important hurdles near 0.8900 to move into a positive zone.

It even cleared the 0.8950 resistance and the 50 hourly simple moving average. The pair traded close to the 0.9000 level and traded as high as 0.8994. It is currently correcting gains and trading below the 0.8980 level.


USD/CHF is testing the 50% Fib retracement level of the recent increase from the 0.8948 swing low to 0.8994 high. The next major support on the downside is near the 0.8960 level or the 50 hourly simple moving average.

There is also a short-term expanding triangle forming with support near 0.8950 on the hourly chart. As long as USD/CHF is above the triangle support, it could climb back towards the 0.9000 resistance level in the near term. The next key resistance could be near the 0.9040 level.

On the downside, the main support is near the 0.8945 level. If the pair fails to stay above the 0.8955 and 0.8945 support levels, there is a risk of a larger decline.

In the stated case, USD/CHF could decline towards the 0.8920 support. There is also a major bullish trend line forming with support near the 0.8900 on the same chart, where the bulls are likely to take a strong stand.
 

Create an account or login to comment

You must be a member in order to leave a comment

Create account

Create an account on our community. It's easy!

Log in

Already have an account? Log in here.

Similar threads

Users Who Are Viewing This Thread (Total: 1, Members: 0, Guests: 1)

Top
AdBlock Detected

We get it, advertisements are annoying!

Sure, ad-blocking software does a great job at blocking ads, but it also blocks useful features of our website. For the best site experience please disable your AdBlocker.

I've Disabled AdBlock    No Thanks