Gold Price Prepares for Next Move, Oil Price Holds Strong
Gold price started a fresh decline and settled below $1,880. Conversely, crude oil price gained bullish momentum and it traded to a new multi-month high close to $54.00.
Important Takeaways for Gold and Oil
- Gold price started a fresh decline below the $1,900 and $1,880 support levels against the US Dollar.
- There is a key contracting triangle forming with resistance near $1,855 on the hourly chart of gold.
- Crude oil price surged above the $50.00 resistance and it even climbed towards $54.00.
- There was a break above a declining channel with resistance near $53.00 on the hourly chart of XTI/USD.
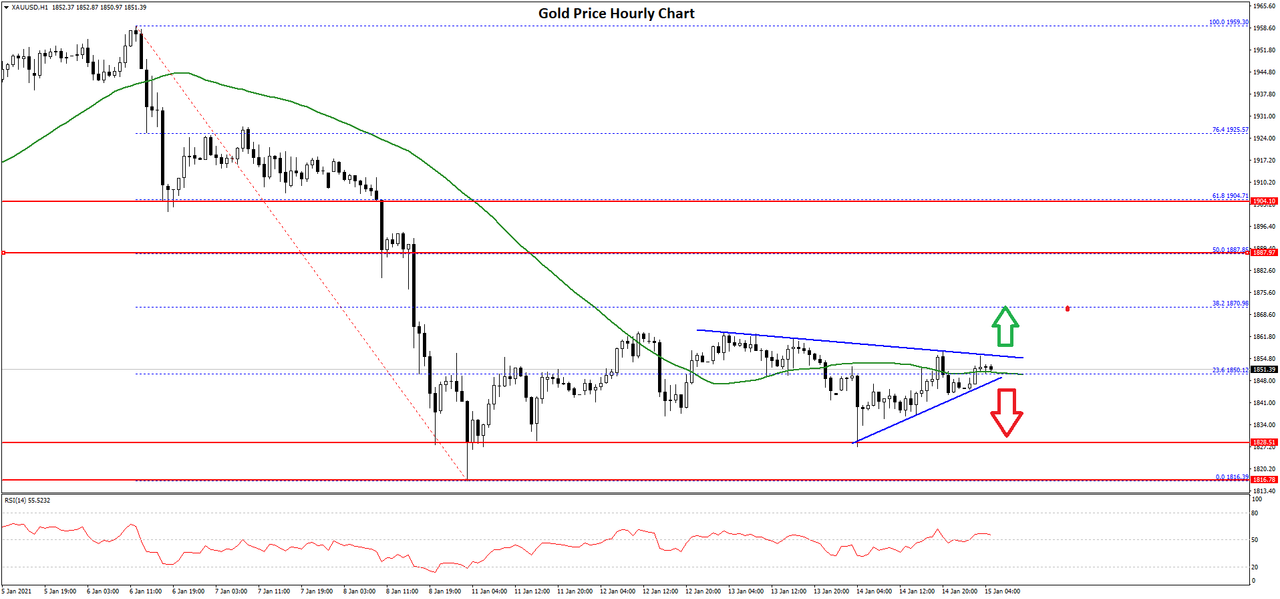
Gold Price Technical Analysis
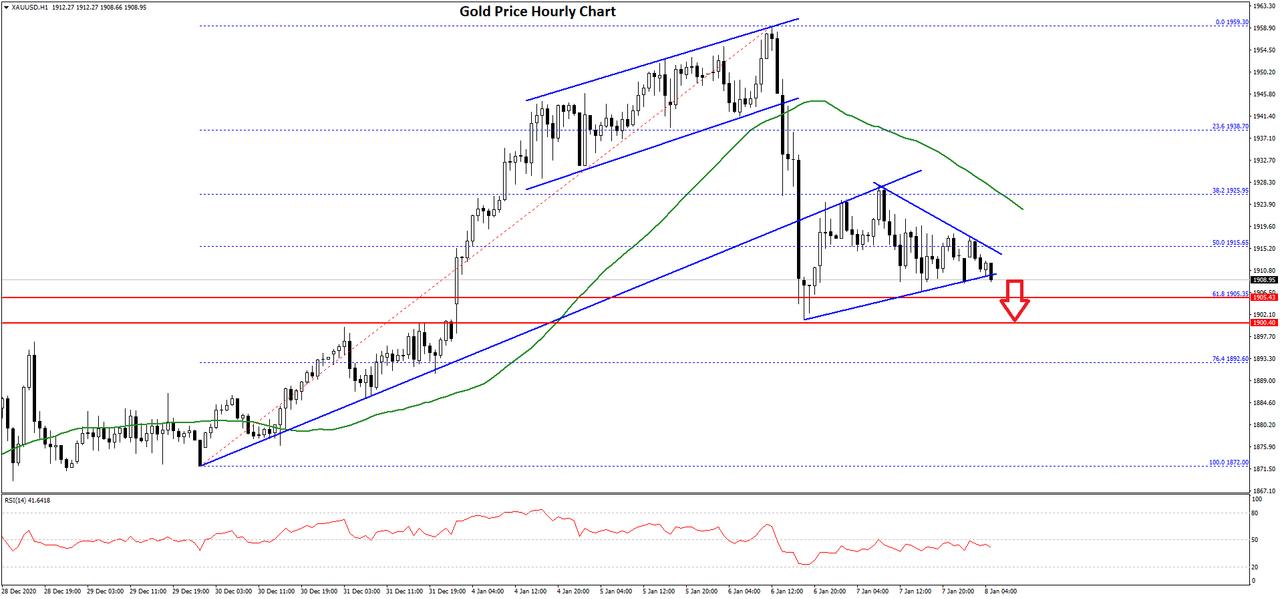
Gold price failed to clear the $1,960 resistance level, and started a fresh decline against the US Dollar. The price broke the $1,900 and $1,880 support levels to move into a bearish zone.
The price followed a bearish path below the $1,850 level and settled below the 50 hourly simple moving average. It traded as low as $1,815 on FXOpen and recently started a short-term upside correction.
There was a break above the $1,825 and $1,830 levels. The price recovered above the 23.6% Fib retracement level of the downward move from the $1,959 swing high to $1,815 low. However, the price is facing hurdles near $1,855 and $1,860.
There is also a key contracting triangle forming with resistance near $1,855 on the hourly chart of gold. A clear break above the triangle resistance could open the doors for a move towards the $1,880 resistance.
The next resistance could be near the 50% Fib retracement level of the downward move from the $1,959 swing high to $1,815 low at $1,887.
Conversely, the price could break the triangle support and continue lower below the $1,840 level. The first key support is near the $1,825 level. The next major support is at $1,815, below which the price might even dive below the $1,800 support level.
Oil Price Technical Analysis
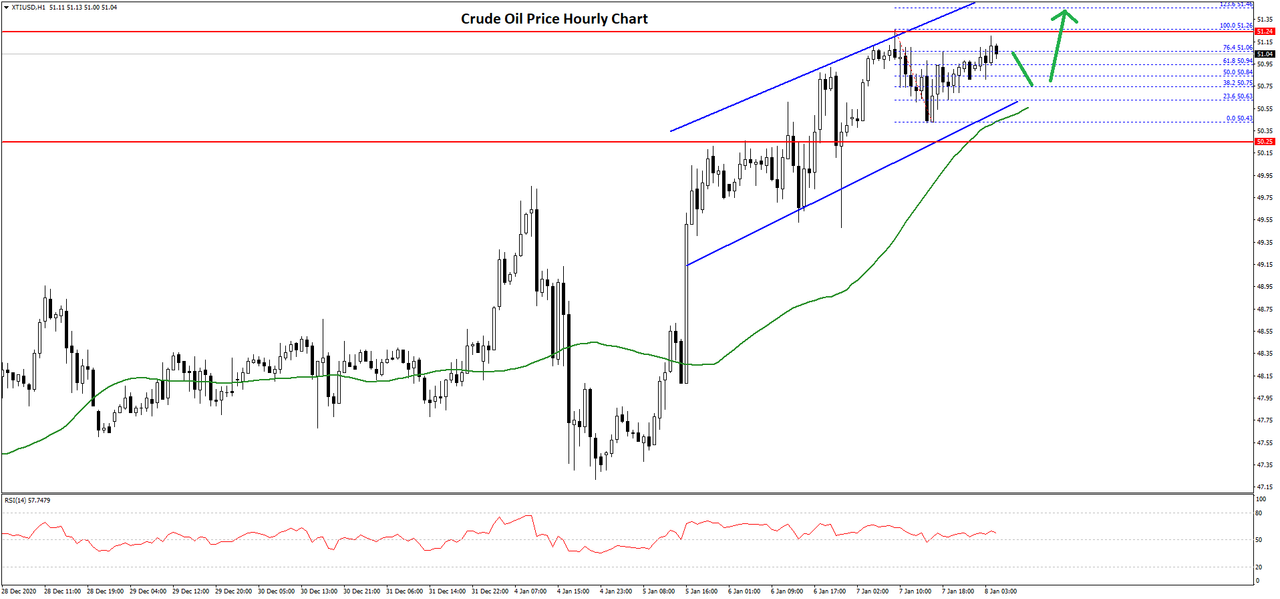
Crude oil price started a strong rise after it broke the $50.00 resistance zone against the US Dollar. The price gained bullish momentum and it even surpassed the $52.00 level.
The bulls remained in action, resulting in a clear break above $52.50. Recently, there was a break above a declining channel with resistance near $53.00 on the hourly chart of XTI/USD. The price traded to a new multi-month high close to $54.00 and settled above the 50 hourly simple moving average.
The recent high was formed near $53.85 and the price is currently correcting lower. It is testing the $53.50 level, which is close to the 23.6% Fib retracement level of the recent wave from the $52.27 swing low to $53.85 high.
If there are more downsides, the price could test the $53.20 support and the 50 hourly simple moving average. The next major support is near the 50% Fib retracement level of the recent wave from the $52.27 swing low to $53.85 high.
Any more losses could lead the price towards the $52.60 support zone. On the upside, the $53.85 and $54.00 levels are initial hurdles. A clear break above $54.00 may possibly lead the price towards the $55.00 level in the near term.