What's new

General About FXOpen – FXOpen.com

4.40 star(s) 7 Votes
Strong Dollar Breaks the Reflation Theme – All Eyes on the U.S. Yields


2020 proved to be a challenging year for currency traders looking to forecast how the U.S. dollar will react to the pandemic. The Federal Reserve of the United States (Fed) immediately lowered the fed funds rate to the lower boundary (i.e., close to zero) and vouched to leave it there for as long as necessary.

On top of that, the Fed restarted the quantitative easing program, buying bonds to lower the yields on the short and long end of the curve. Furthermore, it opened USD swap lines with other central banks in the advanced world to provide liquidity and advert the strong dollar theme.

It worked.

The dollar initially appreciated as the world looked for safety in the face of the pandemic, but then the Fed’s plan entered into effect. Slowly at first, more aggressively after, the dollar started to lose ground across the dashboard.

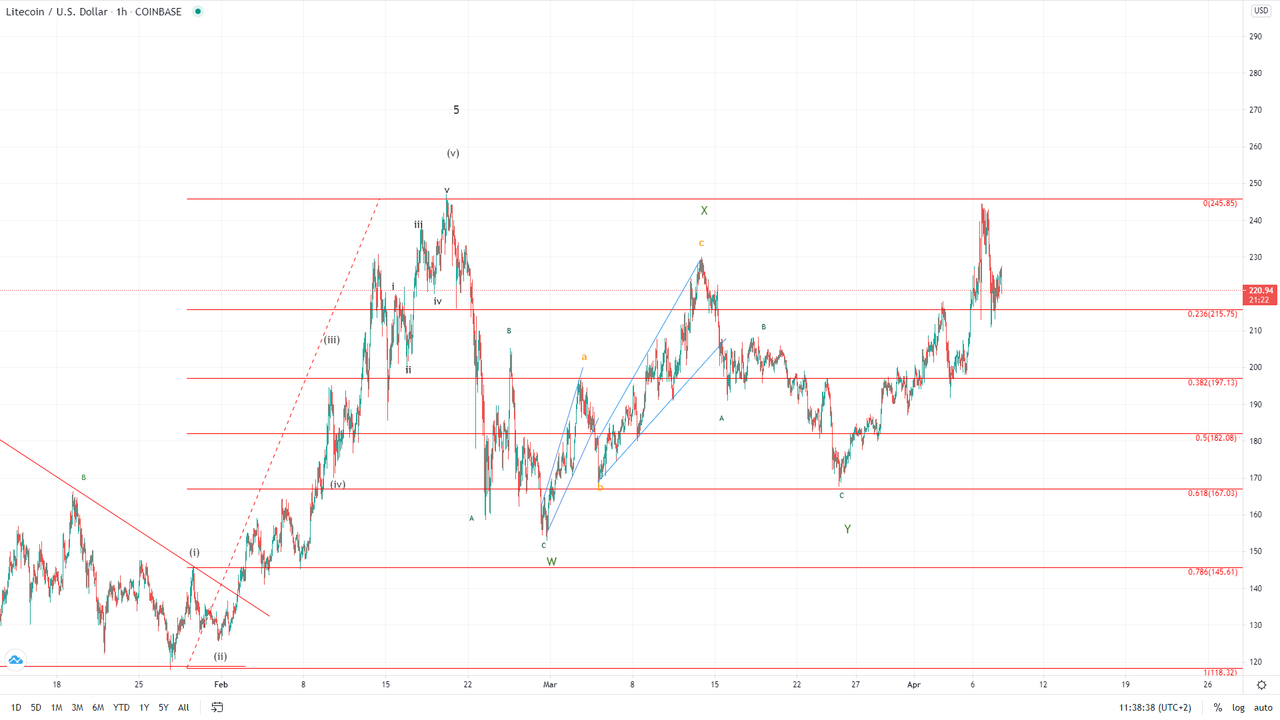
Everything appreciated in dollar terms – the euro, the Australian dollar, the British pound, equities, and commodities alike. The bearish trend on the dollar was so strong that all investment houses forecasted an even lower dollar in 2021.


They were right.

The so-called reflation trade, where U.S. equities advance, the dollar declines, and risk-on dominates, was the theme for most of the first quarter of the year. However, the dollar started to show some strength recently on the back of a faster economic recovery, impressive vaccination campaign, and a U.S. administration that delivers.

What’s Next for the U.S. Dollar?

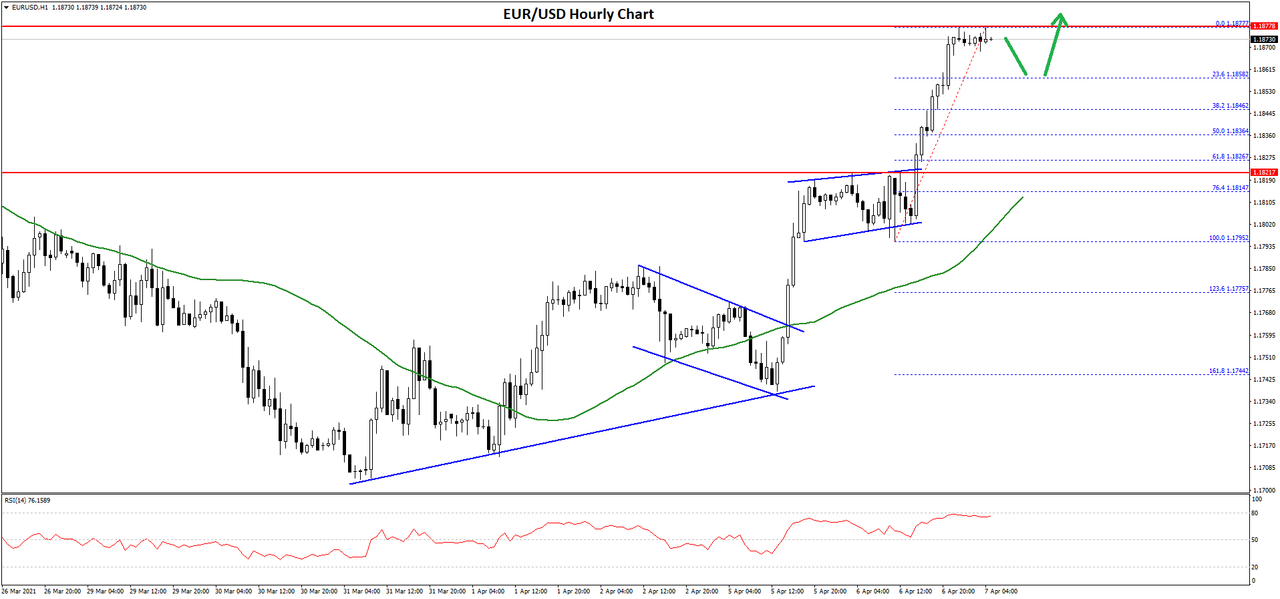
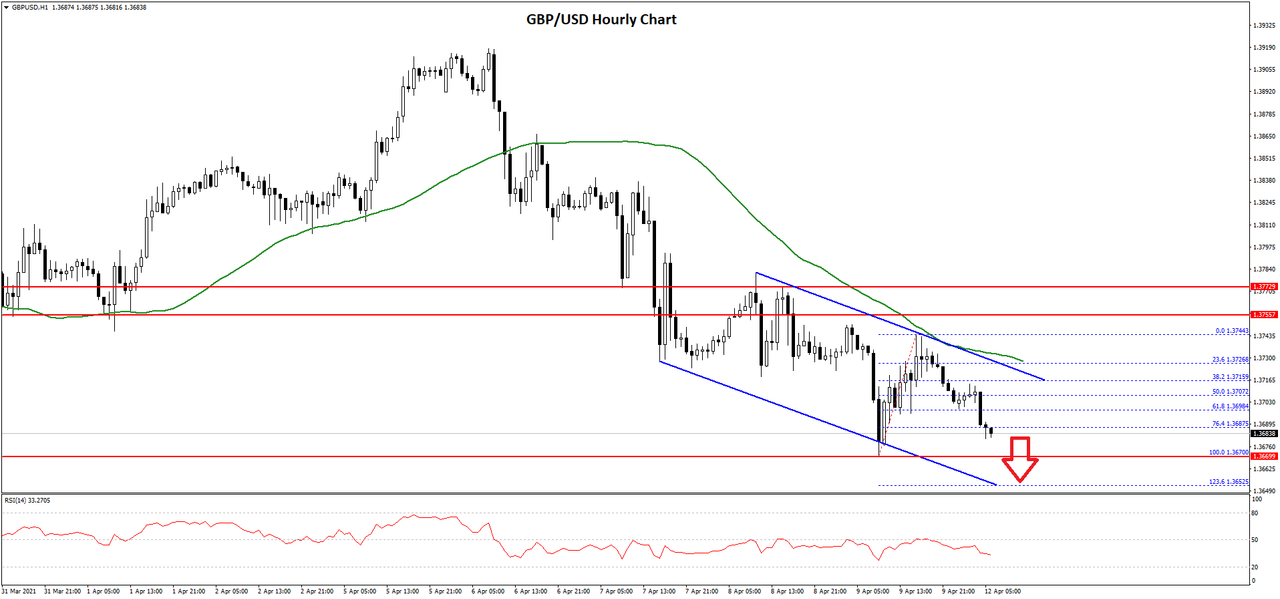
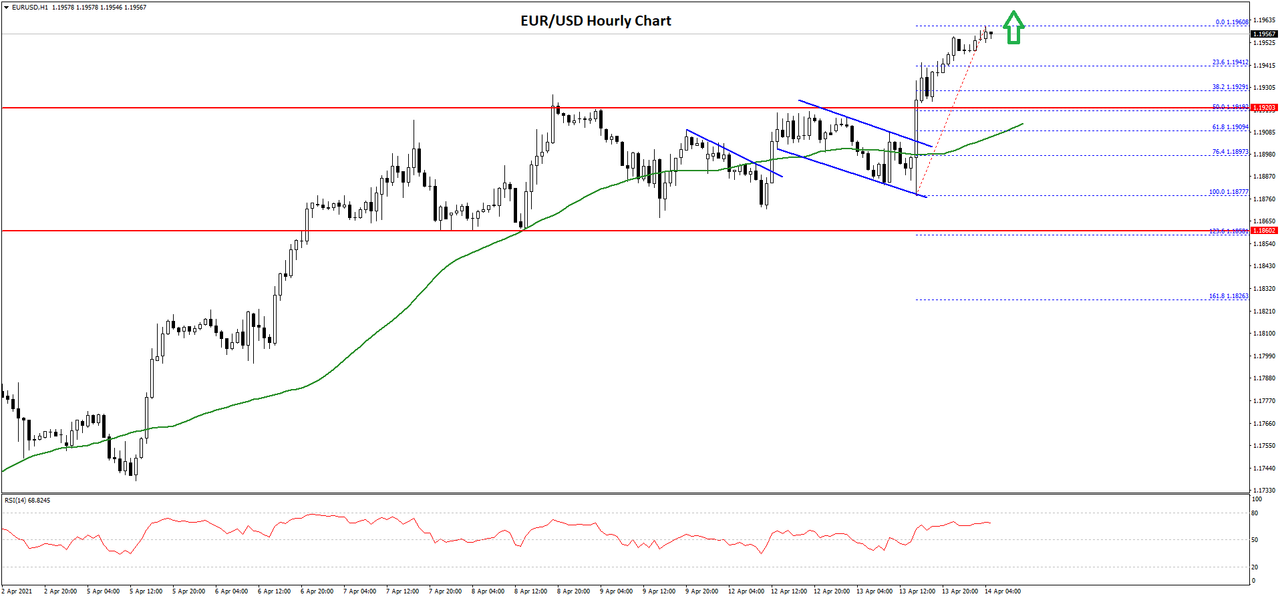
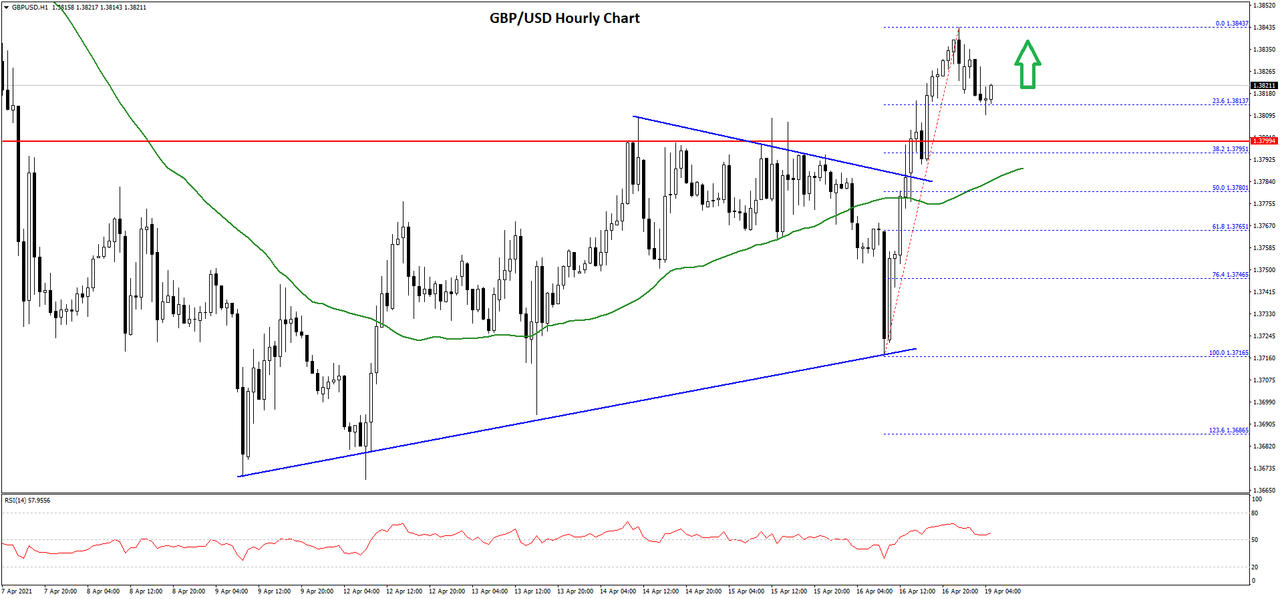
As we head into the second quarter of the year, the dollar trades with a mixed tone. On the one hand, it gained against the euro since the year started.

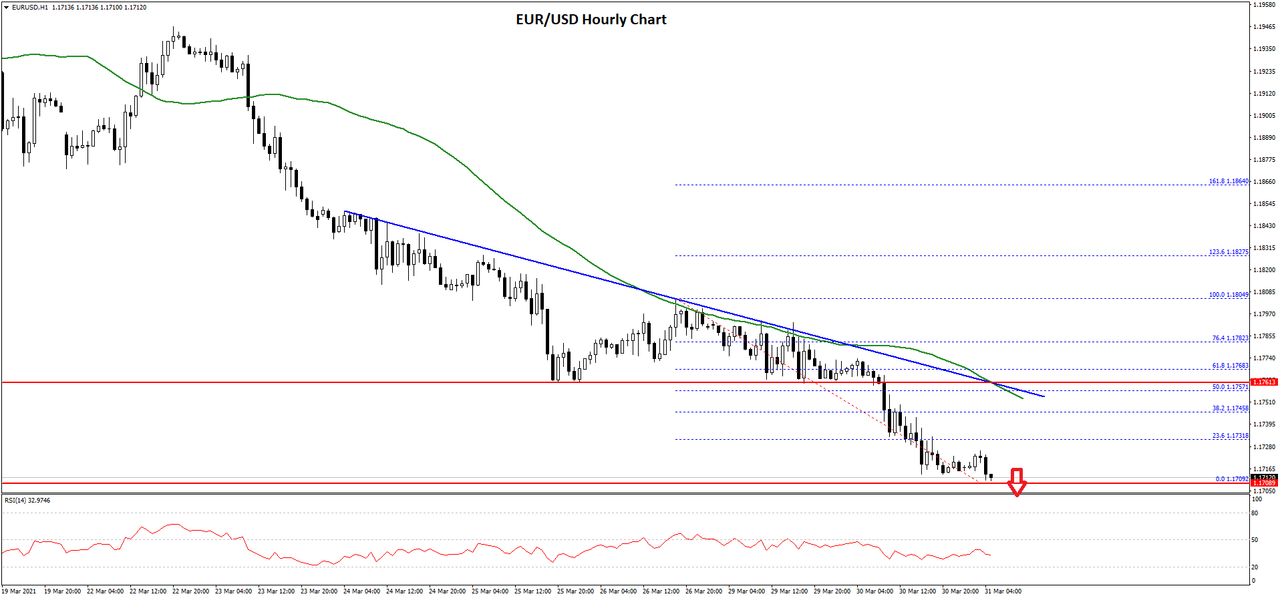
At the start of January, the EURUSD pair traded above 1.23, and last Friday closed below 1.18. Because the euro has the biggest weight in the dollar index, the move lower in the EURUSD exchange rate led to a reversal in the DXY.


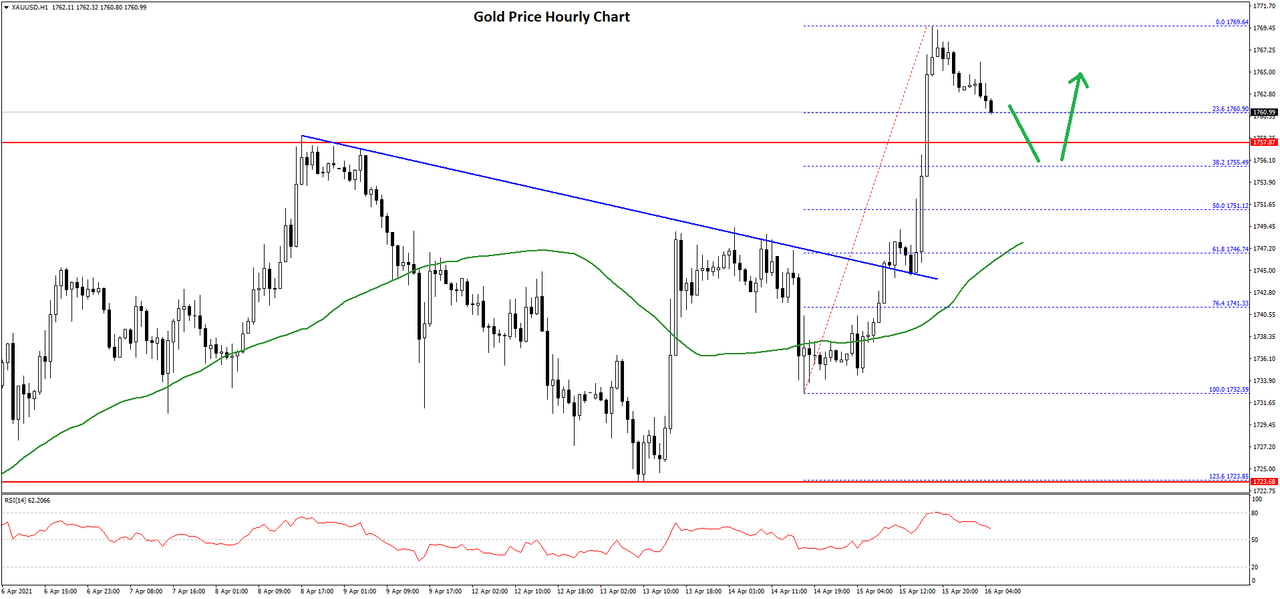
Gold made a new all-time high in 2020 – it traded above $2,000 last summer but is in retreat ever since. It is barely holding above $1,700 at the moment, and fears of higher inflation in the United States and the developed world are not enough to fuel a rally in the yellow metal.

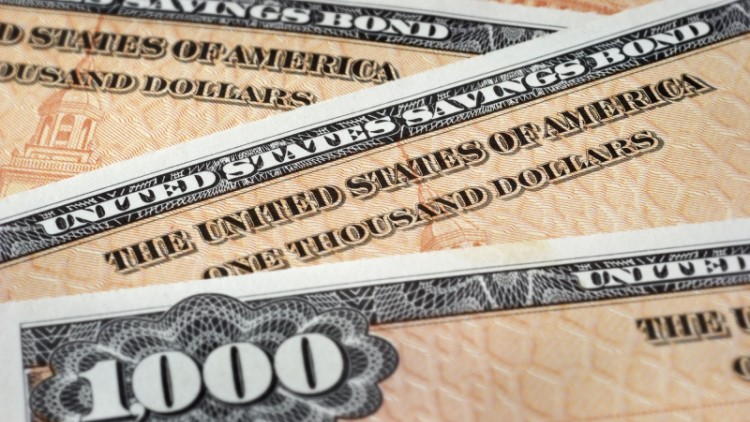
The problem for the reflation trade and gold comes from the fixed-income market. The U.S. yields are rising, and whenever this happened in the past, gold weakened.

Put it simply, rising yields mean that investors flee the safety of bonds in search of higher returns in riskier assets. Effectively, it means that confidence is back and, thus, gold suffers as investors do not look for protection anymore.

Higher yields also bode well for the dollar. Hence, before betting on a lower dollar, investors should first monitor the fixed-income market and interpret where the yields will go.

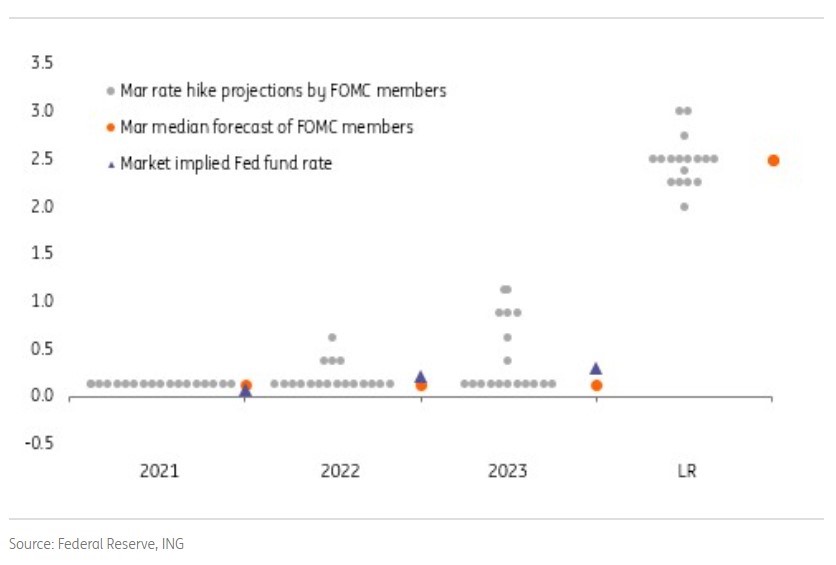
All in all, the second quarter will be extremely interesting. If the yields continue to rise, the dollar will have a hard time weakening.


FXOpen Blog
 
Easter 2020: Changes to Trading Hours

Dear Traders!


Please note that due to the Easter holidays, trading hours for some financial instruments will be changed as follows:

Thursday, April 1st, 2021

Indices CFD:

  • Australia 200 (#AUS200): 01:00 – 16:00;
  • Europe 50 (#ESX50): 01:00 – 23:00;
  • France 40 (#FCHI): 01:00 – 23:00;
  • UK 100 (#UK100): 01:00 – 23:00.

All other financial instruments will be traded without changes.

Friday, April 2nd, 2021

Commodities CFD:
trading closed.

Indices CFD:
  • Australia 200 (#AUS200): trading closed;
  • Europe 50 (#ESX50): trading closed;
  • France 40 (#FCHI): trading closed;
  • Germany 30 (#GDAXIm): trading closed;
  • Hong Kong 50 (#HSI): trading closed;
  • Japan 225 (#J225: 01:00 – 16:15;
  • UK 100 (#UK100): trading closed;
  • US SPX 500 (#SPXm): 01:00 – 16:15;
  • US Tech 100 (#NDXm): 01:00 – 16:15;
  • Wall Street 30 (#WS30m): 01:00 – 16:15.

Stocks CFD: trading closed.

All other financial instruments will be traded without changes.

Monday, April 5th, 2021

Indices CFD:

  • Australia 200 (#AUS200): trading closed;
  • Europe 50 (#ESX50): trading closed;
  • France 40 (#FCHI): trading closed;
  • Germany 30 (#GDAXIm): trading closed;
  • Hong Kong 50 (#HSI): trading closed;
  • UK 100 (#UK100): trading closed.

Stocks CFD:trading closed.

All other financial instruments will be traded without changes.

Monday, April 6th, 2021

Indices CFD:

  • Australia 200 (#AUS200): 02:50 Tue – 00:00 Wed;
  • Europe 50 (#ESX50): 03:15 Tue – 00:00 Wed;
  • France 40 (#FCHI): 09:00 Tue – 00:00 Wed;
  • Hong Kong 50 (#HSI): trading closed;
  • UK 100 (#UK100): 03:00 Tue – 00:00 Wed.

Stocks CFD:trading closed.

All other financial instruments will be traded without changes.

Please consider these changes when planning your trading activities.

FXOpen Company News
 
BTC and XRP – Looking bullish


BTC/USD

The price of Bitcoin has been on the rise since the 25th of March when it fell to $50,420 level. From there a recovery of 17.38% was measured to its highest point so far at $59,236. Currently, it is being traded slightly lower but is still on an upward trajectory.


The low on the 25th was the end of the corrective stage in which the price was since the 13th of March and as the third wave ended we have seen the start of the next impulsive move to the upside.

As its first wave looks like it has already developed now we could be already seeing the start of 3rd sub-wave from the five-wave impulse. The price would be now expected to continue moving upward above its last all-time high and potential somewhere around $68,000-$72,000 zone.

It is still soon to project the ending point so we are going to watch closely how the price action develops and reevaluate our projection accordingly. There could be a possibility that we are seeing an even higher degree impulse wave, increasing the room for growth.

Read Full on FXOpen Company Blog...
 
LTC AND EOS – CONSOLIDATION EXPECTED BEFORE FURTHER UPSIDE


LTC/USD

The price of Litecoin has been increasing since the start of the week and from Monday’s low at $79.215 we have seen a rise of 29.75% measured to its highest point today at $102.781. Currently, the price is being traded slightly lower as a minor pullback was made and is sitting just below the $100 mark.


On the hourly chart, you can see that Monday’s low was a corrective move made after the interaction with the $84 horizontal level which was the end of the first impulse wave out of a five-wave move that started on the 11th. The second wave established support on the $78.44 level from which we have seen a parabolic rise with the price breaking significant resistance with a strong bullish moment.

As this increase was the 3rd wave which appears completed as it can be sub-divided in lower degree five-wave count, we are now likely to see a pullback to around $92 where the prior local resistance level might get tested for support. But after the pullback ends further upside movement would be expected and a higher high compared to today’s one. This expected increase would be the 5th wave that is set to push the price for a higher high and potentially to the $109.35 where the next significant horizontal resistance level is.
Ok hand
 
EUR/USD Dives, USD/CHF Likely To Continue Higher


EUR/USD started a fresh decline below the 1.1800 and 1.1780 support levels. USD/CHF is rising and it is likely to continue higher above 0.9450.

Important Takeaways for EUR/USD and USD/CHF


  • The Euro started a fresh drop below the 1.1850 and 1.1800 support levels against the US Dollar.
  • There is a major bearish trend line forming with resistance near 1.1755 on the hourly chart of EUR/USD.
  • USD/CHF is trading in a bullish zone above the 0.9350 resistance zone.
  • There is a key ascending channel forming with support near 0.9405 on the hourly chart.

EUR/USD Technical Analysis


The Euro failed to stay above the 1.1900 zone and started a fresh decline against the US Dollar. The EUR/USD pair broke the key 1.1850 pivot zone to move into a bearish zone.

The pair even broke the 1.1820 support level and settled below the 50 hourly simple moving average. The bears were able to push the pair below 1.1800 and a low is formed near 1.1709 on FXOpen.

It is currently showing a lot of bearish signs and it seems like there are high chances of more losses below the 1.1700 support zone. The next major support could be near the 1.1660 level, below which the pair may possibly test the 1.1620 support.

On the upside, an initial resistance is near the 1.1730 level. It is close to the 23.6% Fib retracement level of the recent decline from the 1.1804 high to 1.1709 low.

There is also a major bearish trend line forming with resistance near 1.1755 on the hourly chart of EUR/USD. The trend line is close to the 50% Fib retracement level of the recent decline from the 1.1804 high to 1.1709 low.

The 50 hourly simple moving average is also near 1.1760. If there is a break above the trend line resistance, the pair could correct higher towards the 1.1800 zone. The next major resistance is near the 1.1850 level.


Read Full on FXOpen Company Blog...
 
LTC and EOS – More upside expected


LTC/USD

The price of Litecoin has been on the rise from the 25th when it was being traded at $169. We have seen an increase of 18.7% as the price came up to $200 at its highest point today. Currently it is being traded slightly lower but is still in an upward trajectory overall.


Looking at the hourly chart, we can see that the price came up to the 0.382 Fibonacci level and made an attempt to break out above it but failed to do so. The first attempt was made on the 29th from which we have seen some sideways movement below the level before finally another attempt was made today. The price would now be expected to make pullback as the 3rd attempt for a breakout failed, but we haven’t seen a rejection just yet.

If from the 25th we have seen the development of the 4th corrective wave out of the five-wave impulse to the downside now the price would be starting the development of its 5th wave to the downside which would be set to achieve a lower low compared to the 25th one. However, there could be a possibility that the decrease ended as a three-wave move as the part of the higher degree complex correction count, in which case the ascending move would be the first sub-wave of the next starting impulse to the upside.

In either way, we are going to see from the interaction with the 0.382 Fib level what would be the scenario, as if it manages to go above it, it would enter the territory of the 1st wave and invalidated the possibility of a lower low.


Read Full on FXOpen Company Blog...
 
FXOpen Increases Margin Requirements for Rouble Pairs

Dear Traders!


Due to the uncertainty caused by possible sanctions against the Russian Federation, FXOpen is increasing margin requirements for rouble pairs. Margin requirements will increase by 5 (five) times their normal level. The changes are effective starting from April 5, 2021.

We will inform you as soon as margin requirements are back to their previous level.

Please consider these changes when planning your trading activities.

FXOpen Company News
 
Gold Price and Oil Price Eye Additional Gains


Gold price started a fresh increase after testing the $1,680 support zone. Crude oil price is trading nicely above $60.00 and it might continue to rise steadily.

Important Takeaways for Gold and Oil


  • Gold price remained well bid near the $1,680 and $1,675 levels against the US Dollar.
  • There was a break above a major bearish trend line with resistance near $1,708 on the hourly chart of gold.
  • Crude oil price is holding the key $59.50 and $60.00 support levels.
  • There was a break above a key bearish trend line with resistance near $60.55 on the hourly chart of XTI/USD.

Gold Price Technical Analysis

Earlier this week, gold price extended its decline below the $1,710 and $1,700 support levels against the US Dollar. However, the bulls were active near the $1,680 and $1,675 levels.

A low was formed near $1,677 on FXOpen before the price started a fresh increase. There was a break above the $1,695 and $1,700 resistance levels. The price climbed nicely above the 50% Fib retracement level of the downward move from the $1,745 swing high to $1,677


There was also a break above a major bearish trend line with resistance near $1,708 on the hourly chart of gold. The price is now trading well above $1,710 and the 50 hourly simple moving average.

It is now testing the 76.4% Fib retracement level of the downward move from the $1,745 swing high to $1,677 low. A successful break above the $1,730 resistance could open the doors for a larger increase in the coming sessions.

The next key resistance is near the $1,745 level. The main resistance is still near $1,750, above which the price could test $1,780. Conversely, the price could fail to continue higher and it might decline below the $1,720 level.

The main support is near the $1,705 level. A clear break below the $1,705 support may possibly start a strong decline towards $1,675 in the near term.


Read Full on FXOpen Company Blog...
 
GBP/USD Could Accelerate Higher, EUR/GBP Remains At Risk


GBP/USD is facing resistance near 1.3850, but it might accelerate higher. EUR/GBP is facing an increase in selling pressure below 0.8550.

Important Takeaways for GBP/USD and EUR/GBP


  • The British Pound is showing positive signs, but it is facing resistance near 1.3850.
  • There is a key bullish trend line forming with support at 1.3810 on the hourly chart of GBP/USD.
  • EUR/GBP declined below the 0.8580 and 0.8550 support levels.
  • There is a connecting bearish trend line forming with resistance near 0.8510 on the hourly chart.

GBP/USD Technical Analysis


After forming a support base above 1.3720, the British Pound started a fresh increase against the US Dollar. The GBP/USD pair broke the 1.3780 and 1.3800 resistance levels to move into a positive zone.

There was also a close above the 1.3800 level and the 50 hourly simple moving average. The pair is now facing a strong resistance near the 1.3850 level. The recent high was formed near 1.3852 on FXOpen before there was a minor downside correction.

There was a break below the 1.3825 level. The pair even declined below the 23.6% Fib retracement level of the upward move from the 1.3746 swing low to 1.3852 high.

The pair is now holding the 1.3800 support zone and the 50 hourly simple moving average. There is also a key bullish trend line forming with support at 1.3810 on the hourly chart of GBP/USD. The trend line is close to the 50% Fib retracement level of the upward move from the 1.3746 swing low to 1.3852 high.

If there is a downside break below the trend line, the pair could decline towards the 1.3780 and 1.3770 support levels. Any more losses might lead the pair towards the key 1.3720 support.

On the upside, the pair is facing hurdles near the 1.3850 level. A clear upside break above the 1.3850 level could open the doors for a steady increase. In the stated case, GBP/USD could rise towards the 1.6000 level in the near term.


Read Full on FXOpen Company Blog...
 
Global Economic Activity Picks Up On Increased Vaccination Campaigns


As most of the world celebrates Easter, strong signs of economic recovery emerge. Last Friday, with most banks closed, the United States revealed the Non-Farm Payrolls (NFP) numbers for March 2021.

The release exceeded all expectations, showing that the United States economy added close to a million new jobs in only one month. Moreover, the unemployment rate edged down to 6%, a further encouraging sign that the world’s largest economy is recovering from the pandemic.


Furthermore, important revisions to previous data showed that an additional 156k jobs were created in January and February. In total, 1.7 million jobs were added by the United States economy in the first quarter of the year. Because this is the largest economy in the world, the chances are that the positive economic effects will spill over to its main trading partners, fueling a strong economic recovery around the world.
Vaccines Rollout Spurring Economic Growth

Last November, the world found out that science delivered on its efforts to find a vaccine against the COVID-19 virus. For three consecutive weeks, companies like Pfizer/BioNTech, Moderna, or AstraZeneca, released promising data on their vaccine trials.

Fast forward four months to present times, and the vaccines are rolled out around the world. While differences exist in the vaccination pace, the main idea is that the quicker the governments manage to inoculate the population, the faster the economy recovers, and life will get back to normal.


Supply and distribution disparities exist. The United Kingdom and the United States are leading the developed world, while the Euro area is lagging behind.

It all came down to how fast the nations moved to secure the vaccines and what risks they took in the early days of the pandemic. Europe lost momentum in the first quarter, but things look promising starting with April – in the first day of April, over three million people received a vaccine in Europe, a pace that will likely increase moving forward.

If we add the fiscal stimulus in the United States (i.e., $1.9 trillion) already distributed and the upcoming $3 trillion for long-term infrastructure projects, the chances are that the economic data will beat expectations in the months ahead too.

The currency market acted accordingly and rewarded investors closely watching the vaccination race – the U.S. dollar and the British pound rallied in the last months, while the euro lagged. Moving forward, 2021 might be a year dominated by a risk-on environment as the global economy recovers from the pandemic. The key stays with the vaccination campaigns – the quicker the world’s nations inoculate the population, the better for the economic growth.


FXOpen Blog
 
BTC struggling to break $60,000 while Ripple shown a parabolic rise


BTC/USD

The price of Bitcoin has attempted to break the $60,000 last week as we have mostly seen buyers’ pressure on the level throughout the week until Sunday when a decrease was made to $56,466. From there we have seen another increase followed by a higher low and now the price has made a higher high which is a bullish sign. However, it is once again back below the first horizontal level in line at $59,420 and is shortly going to make another breakout attempt.


The uptrend continuation would be expected in either way but it is still unclear whether or not before it we are going to see a deeper retracement. The primary scenario is a bullish one and says that now the price has started developing a new lower degree five-wave move to the upside.

If this is true, then we are going to see another higher low for the 4th wave and potentially an interaction with the all-time high on its ending wave. But this would only be the 1st sub-wave of the higher degree count which is why new highs would be anticipated after a pullback to establish further support.


Read Full on FXOpen Company Blog...
 
EUR/USD and EUR/JPY: Euro is Eyeing More Gains


EUR/USD started a fresh increase above the 1.1820 and 1.1850 resistance levels. EUR/JPY is correcting gains, but it is likely to restart its rise above 130.50.

Important Takeaways for EUR/USD and EUR/JPY


  • The Euro formed a base above 1.1720 and started a fresh increase above 1.1800.
  • EUR/JPY is also trading in a positive zone above the 130.00 support.
  • There is a major bullish trend line forming with support near 129.95 on the hourly chart.

EUR/USD Technical Analysis


After trading close to the 1.1700 level, the Euro started a fresh increase against the US Dollar. The EUR/USD pair broke the 1.1780 and 1.1800 resistance levels to move into a positive zone.

There was also a break above a couple of bullish continuation patterns near 1.1765 and 1.1820 on the hourly chart of EUR/USD. It opened the doors for more gains above the 1.1850 level and the 50 hourly simple moving average.

It traded as high as 1.1877 on FXOpen and it is now consolidating gains. An initial support is near the 1.1855 level. It is near the 23.6% Fib retracement level of the recent increase from the 1.1795 low to 1.1877 high.

Any more losses might call for a test of the 1.1840 support or the 50% Fib retracement level of the recent increase from the 1.1795 low to 1.1877 high. The next major support is near the 1.1800 level or the 50 hourly simple moving average.

On the upside, the pair is facing resistance near the 1.1880 level. The next major resistance is near the 1.1920 level. A clear break above 1.1920 might start a steady increase towards the 1.2000 resistance. The next major resistance above the 1.2000 level sits near the 1.2050 level.


Read Full on FXOpen Company Blog...
 
LTC and EOS – Looking for support


LTC/USD

The price of Litecoin has been rising since last week and came up to its previous high at $244 on the 6th of April. From there we have seen a decline of 13.26% as it came down to $211.62. Currently, it is being traded at around $220.9 as a minor recovery has been made but the price has been moving to the downside again.


On the hourly chart, you can see that the price of Litecoin was on the rise since the 25th of March when it fell down to the 0.618 Fibonacci level. This was at first expected as a corrective 4th wave from the descending impulse wave but as it continued increasing from there above the 0.382 FIb level the count was invalidated which implied that previously we have seen a three-wave correction.

If the previosly seen descending move ended as the higher degree WXY correction then from the 25th of March we have seen the start of the next impulsive move being its first wave. No retracement back to the 0.382 Fib level could be expected as the second sub-wave of the five-wave impulse to the upside from which the price of Litecoin would be set to continue its upward trajectory. However, first, we need to see the establishment of support and the validation of the count so from the momentum and the depth of the expected descending move we are going to reevaluate this possibility.


Read Full on FXOpen Company Blog...
 
AUD/USD and NZD/USD Remains Supported For More Upsides


AUD/USD is following a positive zone and it recently broke the 0.7620 resistance. NZD/USD is also trading in a positive zone above the 0.7030 support.

Important Takeaways for AUD/USD and NZD/USD


  • The Aussie Dollar started a fresh increase above the 0.7580 and 0.7600 levels against the US Dollar.
  • There is a key bullish trend line forming with support near 0.7630 on the hourly chart of AUD/USD.
  • NZD/USD traded as high as 0.7065 and it is currently correcting lower.
  • There is a major bullish trend line forming with support near 0.7025 on the hourly chart of NZD/USD.

AUD/USD Technical Analysis


After testing the 0.7550 support zone, the Aussie Dollar started a fresh increase against the US Dollar. The AUD/USD pair broke a few key hurdles near the 0.7580 level to move into a positive zone.

The pair even broke the 0.7600 level and the 50 hourly simple moving average. It traded as high as 0.7676 on FXOpen and recently corrected lower. The recent swing high was formed near 0.7660 and the pair is now trading below the 0.7650 level.

It broke the 23.6% Fib retracement level of the upward move from the 0.7600 swing low to 0.7660 swing high. It is now testing the 0.7635 support level and the 50 hourly simple moving average.

There is also a key bullish trend line forming with support near 0.7630 on the hourly chart of AUD/USD. The trend line is close to the 50% Fib retracement level of the upward move from the 0.7600 swing low to 0.7660 swing high.

If there is a downside break below the trend line, the pair could dive towards the 0.7600 support zone in the near term. On the upside, the pair is facing hurdles near the 0.7650 and 0.7660 levels.

The main resistance is near the 0.7675 level. A successful close above the 0.7660 and 0.7675 levels could open the doors for a steady increase in the coming sessions. The next key resistance could be 0.7720.


Read Full on FXOpen Company Blog...
 
GBP/USD is Diving, USD/CAD Could Start Steady Increase


GBP/USD failed to stay above 1.3800 and extended its decline. USD/CAD is showing positive signs, but it must clear 1.2570 for a decent increase in the near term.

Important Takeaways for GBP/USD and USD/CAD


  • The British Pound started a fresh decline from well above the 1.3850 support zone.
  • There is a key declining channel forming with resistance near 1.3715 on the hourly chart of GBP/USD.
  • USD/CAD found support near the 1.2525 zone and it is now recovering higher.
  • Earlier, there was a break below a key contracting triangle with support near 1.3565 on the hourly chart.

GBP/USD Technical Analysis


This past week, the British Pound failed to stay above the 1.3850 and 1.3800 support levels against the US Dollar. As a result, the GBP/USD pair started a fresh decline and it even broke the 1.3750 support zone.

There was a close below the 1.3750 level and the 50 hourly simple moving average. The pair declined below the 1.3700 level and it traded as low as 1.3670. Recently, there was an upside correction above 1.3700, but the pair struggled to clear the 1.3750 zone.

A high was formed near 1.3744 and the pair is now declining. It broke the 50% Fib retracement level of the upward move from the 1.3670 low to 1.3744 high.

There is also a key declining channel forming with resistance near 1.3715 on the hourly chart of GBP/USD. The pair is now trading near the 76.4% Fib retracement level of the upward move from the 1.3670 low to 1.3744 high.

It seems like the pair might continue to move down below the 1.3670 support zone. The next major support is near the 1.3620 level, below which the pair might test 1.3580.

On the upside, the 1.3720 zone is a major hurdle along with the 50 hourly simple moving average. A successful close above the 1.3720 and 1.3750 levels could open the doors for a decent increase in the coming sessions.


Read Full on FXOpen Company Blog...
 
Cryptocurrencies Remain Well Bid as Coinbase Goes Public This Week


Over the weekend, the price of Bitcoin extended its rally to above $60,000 again. While not making a new all-time high, Bitcoin remains well bid ahead of the main event of the week ahead – the listing of Coinbase, one of the largest crypto exchanges.

The cryptocurrency market increased in size dramatically in recent years. The interest surrounding cryptocurrencies is on the rise, as suggested by the number of people trading on the various exchanges.


Part of the process of becoming a listed company, Coinbase made public its Q1 2021 numbers. What is interesting is that the number of active traders increased dramatically in the first months of the year, explaining the rise in Bitcoin and other cryptocurrencies.

While many traders focus on Bitcoin only, some other cryptocurrencies had an even better performance than Bitcoin. For example, Ethereum reached a new all-time high over the weekend, and the rally looks poised to continue.

Bitcoin’s detractors argue that the digital currency wastes a vast amount of energy, and thus it is an environmental disaster. Because of that, many traders flee Bitcoin to other alternatives, such as Ether, that do not have such a problem.

Yet, when it comes to institutional investors’ adoption, Bitcoin remains the preferred choice. Moving forward, the price of Bitcoin remains well bid, and so the rally is poised to continue.

Two days from now, Coinbase, one of the largest crypto exchanges in the world, goes public. Companies usually choose to go public during a rising market. Often companies postpone the listing process when markets are falling. But now, the main indices are close to all-time highs, and so the timing of going public boats well for Coinbase and cryptocurrency traders.

Judging by the interest surrounding cryptocurrencies, the chances are that Coinbase’s listing will be a bullish event for the main cryptocurrencies too. As such, Bitcoin and Ethereum remain well bid, with buyers likely to step in on every dip.


FXOpen Blog
 
EUR/USD Gains Traction, USD/JPY Is Extending Losses


EUR/USD started a decent increase after forming a base above the 1.1850 level. USD/JPY is declining and it broke the 109.00 support zone.

Important Takeaways for EUR/USD and USD/JPY


  • The Euro is showing positive signs above the 1.1880 and 1.1900 levels.
  • There was a break above a key declining channel with resistance near 1.1915 on the hourly chart of EUR/USD.
  • USD/JPY started a fresh decline below the 109.20 and 109.00 support levels.
  • There is a major bearish trend line forming with resistance near 109.50 on the hourly chart.

EUR/USD Technical Analysis


After a decent upward move, the Euro settled above the 1.1850 resistance zone against the US Dollar. Recently, the EUR/USD pair formed a support base above 1.1850 and started a fresh increase.

It broke a few important hurdles near the 1.1880 and 1.1900 levels. There was also a break above a key declining channel with resistance near 1.1915 on the hourly chart of EUR/USD. The pair gained pace above the 1.1940 level and settled above the 50 hourly simple moving average.

A high is formed near 1.1960 on FXOpen and the pair is now consolidating gains. An initial support on the downside is near the 1.1940 level.

The 23.6% Fib retracement level of the recent wave from the 1.1877 low to 1.1960 high is also near the 1.1940 level. The next major support on the downside is near the 1.1920 level (the recent breakout zone).

The 50% Fib retracement level of the recent wave from the 1.1877 low to 1.1960 high is also near the 1.1920 level. Any more losses might call for a test of the 1.1850 level. On the upside, the first major resistance is now forming near the 1.1960 levels.

A successful break above the 1.1960 resistance could open the doors for a push towards the 1.2000 resistance zone in the coming sessions.


Read Full on FXOpen Company Blog...
 
LTC and EOS – Resistance found


LTC/USD

The price of Litecoin has reached $282 at its highest point yesterday and after a minor retracement made it back to that area again today. Currently, it is being traded at $271.89 and is looking like it’s moving to the downside.


On the hourly chart, we can see that the price of Litecoin was in an uptrend from the 25th of March when it was traded at $167. Measured to its highest point yesterday that was an increase of 68.8% but what more significant is that it made a higher high compared to the one on the 20th of February. This is why the increase from the 25th is considered the 3rd wave from the higher degree five-wave count. The wave structure implies that it might have ended and considering that we have seen the formation of the ascending channel from the start of the year now a pullback all the way down to its support might occur.

There is still a bit more room to the upside for proper interaction with the channel’s resistance and more so if the level is adjusted to encompass February’s high. However, this structure appears to be an ending diagonal as the 5th wave from the higher degree impulse which is why further interactions with its level would be expected before the completion, meaning we could likely see the price of Litecoin back to $220 area, before another higher high to $330 area.


Read Full on FXOpen Company Blog...
 
Gold Price and Oil Price Could Continue To Rise


Gold price started a fresh increase above the $1,740 resistance zone. Crude oil price is also rising and it is likely to continue higher above $63.50.

Important Takeaways for Gold and Oil


  • Gold price gained pace after it broke the $1,720 and $1,740 resistance levels against the US Dollar.
  • There was a break above a key bearish trend line with resistance near $1,745 on the hourly chart of gold.
  • Crude oil price climbed higher nicely and it settled above the $62.00 support zone.
  • There is a major bullish trend line forming with support near $62.45 on the hourly chart of XTI/USD.

Gold Price Technical Analysis


Earlier this week, gold price formed a decent support base above the $1,725 level against the US Dollar. As a result, there was a fresh increase above the $1,730 and $1,740 levels.

There was a break above a key bearish trend line with resistance near $1,745 on the hourly chart of gold. The price gained pace above the $1,750 level and it settled well above the 50 hourly simple moving average.

It even traded above the $1,765 level and a high is formed near $1,769 on FXOpen. The price is now correcting lower and trading below the $1,765 level.

It is testing the 23.6% Fib retracement level of the upward move from the $1,732 low to $1,769 high. An immediate support on the downside is near the $1,758 level. The next major support on the downside is near the $1,755 level.

Any more losses might call for a test of the $1,750 support. It is near the 50% Fib retracement level of the upward move from the $1,732 low to $1,769 high.

On the upside, the $1,768 and $1,770 levels are immediate hurdles. A clear break above $1,770 might open the doors for a steady increase towards the $1,780 level. The next key resistance is near the $1,800 level.


Read Full on FXOpen Company Blog...
 
GBP/USD Eyes More Upsides, EUR/GBP Holding Key Support


GBP/USD is showing positive signs above 1.3800 and 1.3780. EUR/GBP is showing bearish signs and it is testing a major support near 0.8640.

Important Takeaways for GBP/USD and EUR/GBP


  • The British Pound started a decent increase from the 1.3720 support zone.
  • There was a break above a key contracting triangle with resistance near 1.3780 on the hourly chart of GBP/USD.
  • EUR/GBP failed to continue higher above 0.8720 and corrected lower.
  • There was a break below a major contracting triangle with support near 0.8685 on the hourly chart.

GBP/USD Technical Analysis

After forming a support base above 1.3700, the British Pound started a fresh increase against the US Dollar. The GBP/USD pair broke the 1.3750 and 1.3800 resistance levels to move into a positive zone.

There was also a close above the 1.3800 level and the 50 hourly simple moving average. During the increase, there was a break above a key contracting triangle with resistance near 1.3780 on the hourly chart of GBP/USD.


The pair climbed above the 1.3820 level and traded as high as 1.3843 on FXOpen. Recently, there was a downside correction from the 1.3843 high.

The pair tested the 23.6% Fib retracement level of the upward move from the 1.3716 swing low to 1.3843 high at 1.3813. The next major support on the downside is near the 1.3800 zone (the recent breakout zone).

Any more losses could initiate a drop towards the 1.3780 support or the 50 hourly simple moving average. The 50% Fib retracement level of the upward move from the 1.3716 swing low to 1.3843 high is also near the 1.3780 level.

On the upside, the 1.3840 and 1.3850 levels are immediate hurdles. A successful break above 1.3850 might clear the path for more gains above the 1.3880 and 1.3900 levels.


Read Full on FXOpen Company Blog...
 

Create an account or login to comment

You must be a member in order to leave a comment

Create account

Create an account on our community. It's easy!

Log in

Already have an account? Log in here.

Similar threads

Users Who Are Viewing This Thread (Total: 1, Members: 0, Guests: 1)

Top
AdBlock Detected

We get it, advertisements are annoying!

Sure, ad-blocking software does a great job at blocking ads, but it also blocks useful features of our website. For the best site experience please disable your AdBlocker.

I've Disabled AdBlock    No Thanks