What's new

Daily Market Analysis and Overview by Unitedpips

5.00 star(s) 1 Vote
Understanding EUR/USD Daily Market Dynamics


Introduction to EURUSD

The EUR-USD currency pair, commonly known as "Fiber," represents the exchange rate between the Euro and the US Dollar. It's one of the most liquid and widely traded currency pairs globally, highly favored by forex traders due to its volatility and substantial trading volume. Understanding EUR/USD movements provides essential insights into economic health and monetary policy differences between the Eurozone and the United States.


EUR-USD Market Overview
EURUSD is experiencing mixed signals influenced by recent economic data from both Europe and the United States. Currently, the pair is affected by hawkish expectations from upcoming US Federal Reserve member speeches, notably from Mary Daly and Jerome Powell, indicating potential tightening in monetary policy. US Producer Price Index (PPI) and Retail Sales data are key drivers this week, potentially supporting the USD if the actual figures outperform forecasts. On the Euro side, economic indicators such as the Wholesale Price Index (WPI), Consumer Price Index (CPI), and Industrial Output provide a cautious yet stable outlook. Traders should closely watch these indicators, as better-than-expected results from the US could strengthen the Dollar, pressing the EUR/USD lower in the short term.

D1_Daily_EURUSD_technical_and_fundamental_Analysis_and_Price_Action..jpg

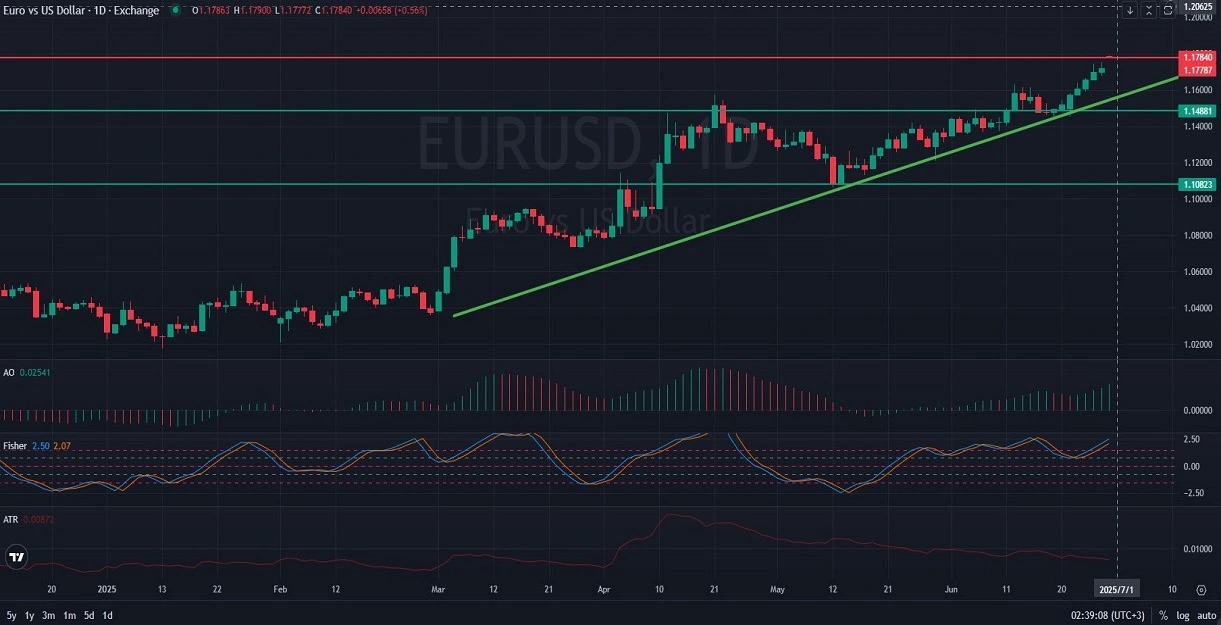
EUR/USD Technical Analysis

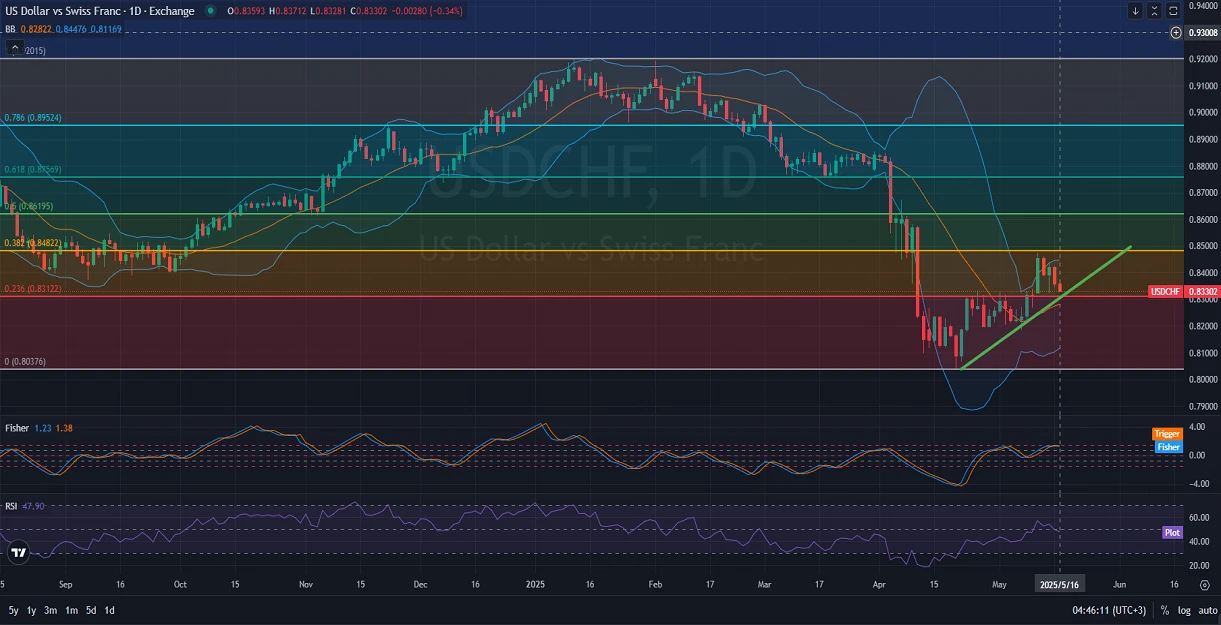
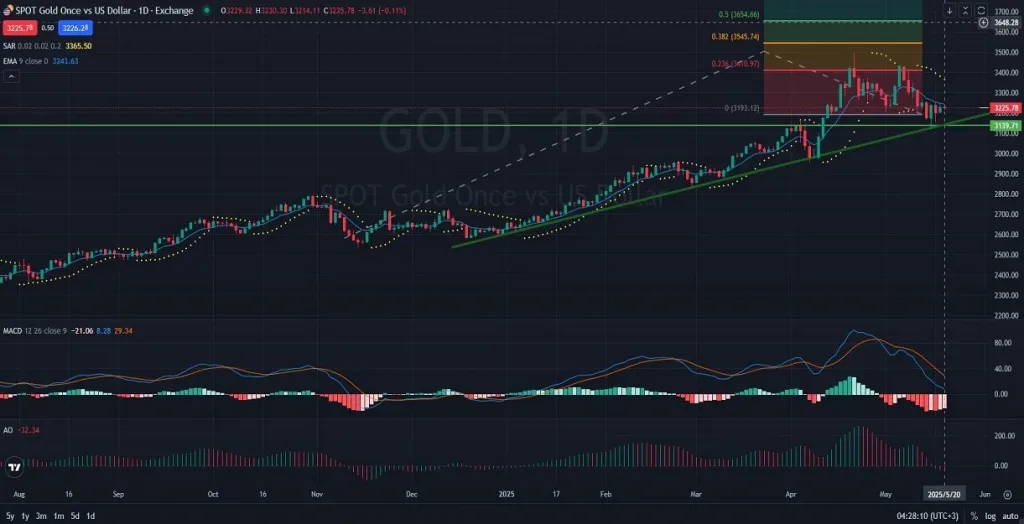
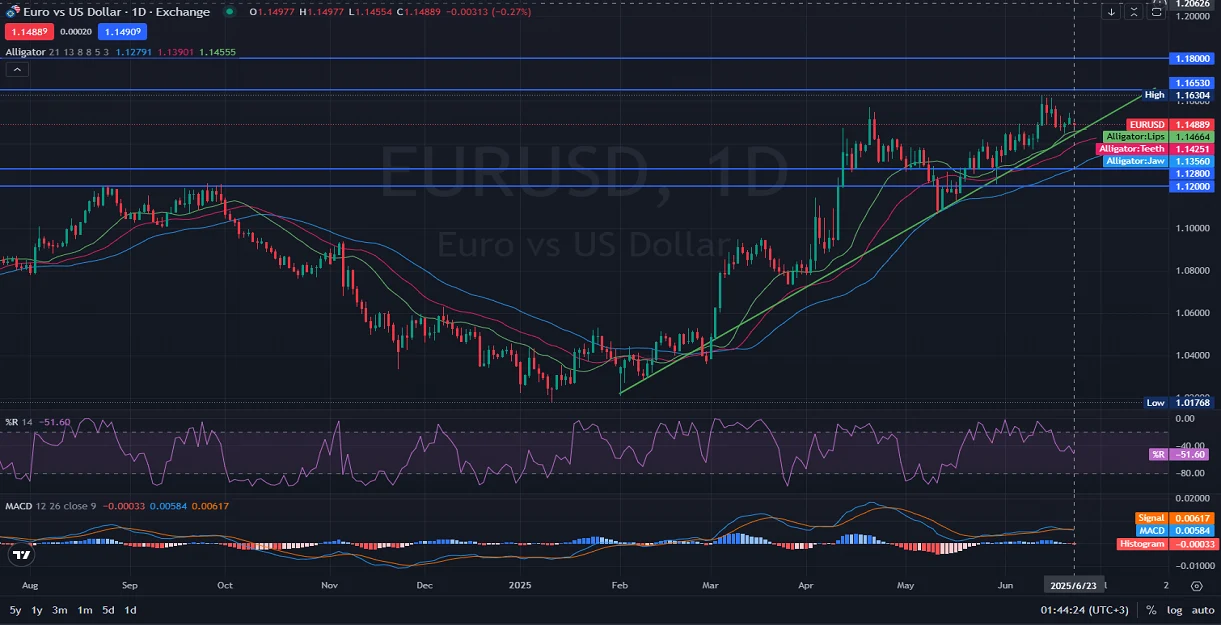
On the daily chart, EURUSD recently embarked on an upward trend but encountered strong resistance around the 1.11735 level, failing to stabilize above it and subsequently falling back below this critical resistance zone. The pair has completed a corrective move, finding support precisely at the Fibonacci retracement level of 0.382, suggesting a potential rebound. The 9-day EMA indicates cautious optimism, but the Parabolic SAR shows bearish sentiment persists for now. Fisher Transform oscillates in negative territory, highlighting the ongoing bearish momentum, while the MACD histogram remains below zero, affirming the short-term downward bias. Traders should watch for a sustained breakout above 1.11735 as confirmation of bullish revival.


Final Words about EUR vs USD
Considering the current technical and fundamental backdrop, EUR-USD appears to be at a critical juncture with potential bullish opportunities contingent upon breaking above the key resistance of 1.11735. However, strong upcoming USD-related economic events and Fed speeches could intensify market volatility, potentially maintaining downward pressure on the pair. Forex traders should carefully monitor these developments, managing risks prudently and staying adaptive to rapid market shifts. Clear trading signals from both technical indicators and economic data will be crucial for accurate market positioning in the coming sessions.


05.15.2025
 
USD vs CHF: Economic Indicators and Price Action Analysis


Introduction to USDCHF
The USDCHF pair, commonly known as the "Swissie," reflects the exchange rate between the US dollar and the Swiss franc. Renowned for its stability, this currency pair is popular among traders seeking safe-haven assets. Changes in USD CHF are often influenced by economic developments from both the United States and Switzerland, highlighting its importance as an indicator of economic stability and market sentiment.


USD/CHF Market Overview
The USD/CHF pair has recently experienced volatility, impacted by significant economic announcements from both countries. Recent US economic data, such as residential building permits and construction starts, have shown positive momentum, potentially strengthening the USD. Additionally, upcoming speeches from Federal Reserve members, including Richmond Fed President Thomas Barkin, are closely monitored by traders for monetary policy clues that could affect the dollar's strength. Conversely, the Swiss franc awaits influential insights from SNB Chairman Martin Schlegel, whose upcoming speech on monetary policy amid geopolitical uncertainties may heighten volatility for CHF. Overall, market sentiment remains cautious, with traders carefully watching economic indicators for potential directional cues.


USD-CHF Technical Analysis
Analyzing the daily chart, USD-CHF is showing an attempted correction from its recent bearish trend. The price has been moving upward, bouncing from the Fibonacci retracement levels at 0 and testing resistance around the 0.382 level. The pair has been recently trading within the upper half of the Bollinger Bands, indicating mild bullish momentum. Indicators such as the Fisher Transform and RSI are moderately positioned, suggesting that the upward correction may continue but remains vulnerable to market sentiment and technical resistances. Traders should closely monitor the 0.382 Fibonacci level at approximately 0.8482 as a crucial resistance zone.


Final Words about USD vs CHF
Given the current technical and fundamental outlook, USD/CHF might continue its cautious recovery, although resistance levels could limit significant gains. Traders are advised to closely monitor upcoming speeches from central bank officials and US economic indicators, which could provide clearer market directions. Short-term price actions around key Fibonacci levels will be crucial in identifying future trends. Maintaining risk management strategies is essential due to potential market volatility stemming from geopolitical and economic announcements.


05.16.2025
 
Gold Daily Technical Analysis & Market Outlook


Introduction to XAU/USD
Gold/USD, commonly known as XAU/USD, is one of the most heavily traded commodity pairs in the global financial markets. This pair reflects the price of gold in US dollars, serving as a crucial indicator for global economic health and market sentiment. Often referred to as a safe-haven asset, gold tends to rise in value during economic uncertainty or inflationary pressures. Investors and traders closely monitor this pair to hedge against market volatility.


Gold/USD Market Overview
Currently, XAUUSD exhibits an overall bullish market sentiment, supported by its recent trend-line bounce and global economic conditions. Upcoming speeches from key Federal Reserve officials, including Thomas Barkin, Raphael Bostic, and Alberto Musalem, will likely significantly influence the USD strength and indirectly affect gold prices. Any indication of a hawkish stance from these FOMC members could strengthen the USD, potentially limiting gold's upward momentum. Conversely, a dovish outlook or economic uncertainty suggested in these speeches could further fuel gold's bullish trajectory. Traders should closely follow these events, particularly the remarks on monetary policy, which are expected to set short-term market direction.


XAU/USD Technical Analysis
Analyzing the daily timeframe (D1) for XAUUSD, the price is currently demonstrating strong bullish behavior following a significant correction. The price recently found support at the ascending trend line, indicating solid buyer interest at these lower levels. Key technical indicators further support this bullish outlook: the price has respected the 9-day EMA, while the Parabolic SAR indicator remains bullish beneath the current price levels. Additionally, the MACD histogram is nearing a bullish crossover, suggesting growing upward momentum. The Awesome Oscillator also hints at reducing bearish pressure, aligning with the potential continuation of the bullish trend toward Fibonacci extension targets around 3,545 and 3,655 levels.


Final Words about XAU vs USD
In summary, Gold/USD remains positioned to continue its bullish run, bolstered by technical strength and global economic factors. Traders should stay vigilant about upcoming Fed communications, as these will heavily influence short-term price actions. Current technical indicators strongly favor continued upward movement, but investors should watch for a confirmed bullish crossover on the MACD as additional validation. Maintaining close attention to support at the rising trend line around the 3,193 level will be critical. As always, careful risk management is essential given potential volatility from upcoming economic news.


05.20.2025
 
GBP/USD Daily Technical and Fundamental Milestones


Introduction to GBP/USD

GBP/USD, often referred to as "Cable," is one of the most widely traded currency pairs in the forex market. It represents the exchange rate between the British pound sterling and the US dollar. This pair is influenced by economic data, interest rate decisions, and political developments from both the United Kingdom and the United States. As two of the world’s largest and most developed economies, movements in GBP/USD are closely tied to central bank policies—particularly those of the Bank of England and the Federal Reserve—as well as macroeconomic indicators such as GDP, inflation, and employment figures. Traders monitor this pair to gauge relative economic strength and capitalize on volatility driven by geopolitical events and market sentiment.


GBP/USD Market Overview
Currently, GBP/USD shows a bullish market sentiment, bolstered by stronger-than-expected UK inflation data. The latest Consumer Price Index (CPI) rose 3.3% year-over-year, well above the forecasted 2.6%, while Core CPI and Retail Price Index (RPI) also exceeded expectations. These figures suggest persistent inflationary pressures in the UK, increasing the likelihood of a more hawkish stance from the Bank of England. On the US side, a larger-than-expected draw in crude oil inventories and upcoming speeches from FOMC members Thomas Barkin and Michelle Bowman could influence USD direction. Should their remarks indicate a continued tightening bias, it may strengthen the dollar and limit GBP/USD's upside. However, any dovish signals or market concerns over US growth could reinforce the pair’s bullish trajectory. Traders should monitor these developments closely, as they are likely to set the tone for short-term price action.

GBPUSD.png

GBP/USD Technical Analysis
Analyzing the daily timeframe (D1) for GBP/USD, the pair is currently displaying bullish momentum within a well-defined ascending channel. Price action has recently broken out of a consolidation triangle, with strong support around the 1.3193 level and resistance near 1.3441. The Bollinger Bands show price expanding toward the upper band, suggesting increased volatility and buying pressure. Moreover, the 100-day moving average (MA) at 1.2828 remains well below the current price, reinforcing the longer-term bullish trend. The pair's recent bounce from mid-channel support, coupled with stronger-than-expected UK inflation data, strengthens the outlook for continued upside toward the 1.3440–1.3500 resistance zone. Traders should watch for confirmation of sustained breakout above the consolidation range as a signal for trend continuation.


Final Words about GBP vs USD
GBP/USD continues to attract strong interest from traders amid a favorable blend of technical and fundamental signals. With UK inflation exceeding forecasts and the pair holding firmly above key support levels within an ascending channel, the overall outlook remains bullish. Technical indicators, including the 100-day moving average and expanding Bollinger Bands, support the case for further upside. However, potential shifts in US monetary policy, especially following key speeches from FOMC officials, could introduce short-term volatility. As such, traders should remain vigilant, balancing the current bullish bias with awareness of upcoming macroeconomic events that may influence market direction.


05.21.2025
 
Understanding USD/CAD Daily Price Action


Introduction to USDCAD
The USD-CAD, commonly known as the "Loonie," is one of the major currency pairs representing the exchange rate between the US Dollar and the Canadian Dollar. This pair reflects economic relations and trade dynamics between two significant North American economies. Traders closely monitor USD/CAD to gauge cross-border economic health, commodity market influences—especially oil—and monetary policy shifts.


USD-CAD Market Overview
Currently, USD CAD is navigating complex market dynamics influenced by recent economic indicators and central bank communications. In the US, attention is focused on upcoming speeches from FOMC members Alberto Musalem, Jeffrey Schmid, and Lisa Cook, whose hawkish statements could strengthen the US Dollar. Additionally, US New Home Sales data will provide insight into economic health, further influencing USD sentiment. In Canada, traders anticipate Retail Sales and Core Retail Sales reports, vital indicators of consumer confidence and spending strength. Corporate profits data will also shed light on broader economic trends, potentially affecting CAD strength.


USD/CAD Technical Analysis
On the daily chart, USD-CAD is testing a critical support level at 1.38261. If the price successfully holds above this key support, we could see bullish momentum returning, aiming for the resistance level at 1.40243, which was recently broken. Technical indicators currently present mixed signals; the Alligator indicator shows bearish momentum, indicating cautiousness for potential upward movements. The Momentum oscillator suggests the bearish sentiment is stabilizing, implying that downward pressure might weaken soon. Additionally, the Relative Strength Index (RSI) is at 42, near neutral territory but slightly leaning bearish, suggesting potential consolidation before a decisive move.


Final words about USD vs CAD
Considering the ongoing market conditions and key economic releases, USD/CAD is positioned for potential volatility. Traders should closely monitor speeches by Federal Reserve officials for hawkish or dovish signals that may significantly impact USD strength. Meanwhile, Canadian economic data, particularly retail sales figures, will be pivotal in guiding CAD performance. Risk management strategies remain crucial, as both technical and fundamental factors suggest the pair could experience sharp movements soon. Being prepared for rapid changes in sentiment will be beneficial for traders navigating this pair.


05.23.2025
 
GBP/USD Daily Analysis: Cable Faces Key Resistance


Introduction to GBP-USD
The GBPUSD currency pair, commonly known as "Cable," represents the exchange rate between the British Pound (GBP) and the US Dollar (USD). As one of the oldest and most traded currency pairs globally, Cable provides critical insights into the comparative economic strength and financial policies of the United Kingdom and the United States. This pair attracts significant attention from traders and investors due to its volatility and sensitivity to global economic events.


GBP/USD Market Overview
Currently, GBP USD is experiencing bullish momentum, testing significant resistance levels after recently breaking above critical technical points. Market sentiment remains influenced by various macroeconomic factors and recent news. Notably, Federal Reserve Bank of Minneapolis President Neel Kashkari’s upcoming panel discussion on monetary policy may impact USD strength if hawkish signals emerge. Additionally, US durable goods orders data and housing price indices have contributed to a generally positive sentiment around USD. Meanwhile, the British Retail Consortium’s recent inflation report and upcoming Confederation of British Industry (CBI) sales data could further clarify GBP direction, impacting trading decisions significantly.


GBPUSD Technical Analysis
Technically, GBP/USD has successfully breached several resistance levels and has recently broken a crucial resistance line at 1.34179, signaling continued bullish potential. Price action suggests a likely retest of the newly established support level around 1.34179 before potentially resuming upward. Currently, GBP/USD faces immediate resistance at the upper band of the ascending channel, a critical indicator of future price direction. The 21-day Exponential Moving Average (EMA 21) continues to indicate bullish sentiment as it slopes upward, suggesting further bullish support. The Linear Regression Slope oscillator is currently neutral, while the Relative Strength Index (RSI) at 67.04 indicates strong buying momentum, approaching overbought conditions.


Final Words about GBP vs USD
Given the current bullish momentum and supportive technical indicators, GBP/USD seems poised for further upward movement in the short term, albeit with cautious monitoring of overbought signals. Traders should closely observe the upcoming US economic releases and Fed communications, as these can significantly shift market dynamics. Additionally, GBP-specific data from the retail and wholesale sectors will be critical in sustaining or challenging the current bullish outlook. Effective risk management remains essential due to potential volatility from unforeseen economic shifts and policy announcements.


05.27.2025
 
Indicators Signal Caution Ahead of EURUSD


Introduction to EUR-USD

The EURUSD currency pair, often referred to simply as "Euro-Dollar," represents the exchange rate between the Euro (EUR) and the US Dollar (USD). As the most traded currency pair in the world, EURUSD serves as a benchmark for global forex markets and reflects the relative economic performance and monetary policies of the Eurozone and the United States. Known for its high liquidity and tight spreads, the pair is closely watched by traders, investors, and policymakers alike, as it reacts strongly to geopolitical developments, interest rate decisions, and macroeconomic data from both regions.


EUR/USD Market Overview
Currently, EURUSD is showing cautious bullish tendencies as it navigates through key technical zones, supported by mixed but largely optimistic economic data from the Eurozone. Early in the day, German Import Prices dropped more than expected at -1.4%, potentially signaling easing inflation pressures, while French Consumer Spending rebounded strongly with a 0.8% increase, reversing last month’s sharp decline. Stable readings in French Private Payrolls and GDP further reflect economic resilience within the region. Meanwhile, a sharper-than-expected rise in German Unemployment Change (+12K vs. 4K forecast) has tempered some of the bullish sentiment, highlighting underlying labor market challenges. On the U.S. side, attention is focused on upcoming events that may shape USD direction. Federal Reserve Bank of Minneapolis President Neel Kashkari’s speech and the release of FOMC Meeting Minutes are highly anticipated, especially for clues on future monetary policy. Additionally, a slightly better-than-expected Richmond Manufacturing Index may provide modest support to the USD.

EURUSD.png

EURUSD Technical Analysis
Technically, EUR/USD is currently exhibiting signs of bullish consolidation after a strong upward move earlier this month. The pair has held above a key support zone between 1.11564 and 1.13110, which has previously acted as a strong demand area. This zone is now serving as a critical pivot, with price action showing resilience above it despite minor pullbacks. The Parabolic SAR dots remain below the price, confirming continued bullish momentum, although they are beginning to flatten, which could indicate a potential pause or short-term correction. Meanwhile, the Stochastic Oscillator shows a reading of 78.47 and 69.76, suggesting the pair is approaching overbought territory. This raises the likelihood of a near-term pullback or consolidation phase before any renewed push higher. Should EUR/USD sustain momentum above 1.13110, the next major resistance lies around 1.1500, followed by the psychological 1.2000 zone. However, a breakdown below 1.11564 could open the door to deeper retracements. Overall, technical indicators point to a bullish bias, but with caution warranted as overbought conditions begin to emerge.


Final Words about EUR vs USD
In summary, the EUR/USD currency pair remains at a critical juncture, shaped by a combination of encouraging Eurozone data and looming U.S. monetary policy developments. While recent economic releases suggest underlying strength in the Euro area, particularly in consumer activity and GDP stability, concerns such as rising German unemployment and anticipated Fed commentary introduce an element of uncertainty. Technically, the pair maintains a bullish structure above key support, though overbought signals on the Stochastic Oscillator and flattening Parabolic SAR suggest the potential for a short-term pause or correction. As markets await further direction from upcoming U.S. policy statements, traders should remain vigilant, balancing the current bullish outlook with the possibility of near-term volatility.


05.28.2025
 
Bitcoin Price Analysis: BTC/USD Daily Outlook and Market Sentiment


Introduction to BTC-USD

The BTCUSD pair, often referred to as Bitcoin-Dollar or simply "Bitcoin against the dollar," reflects the value of Bitcoin relative to the United States dollar. It is one of the most watched and traded cryptocurrency pairs in the financial markets. Traders use BTC/USD to speculate on Bitcoin’s price movement, hedge their digital assets, or simply to convert BTC into USD. Given Bitcoin's decentralized nature and the USD’s global dominance, this pair offers unique volatility and opportunity for both short-term and long-term traders.


BTCUSD Market Overview
BTC USD has recently reached a new all-time high and is now undergoing a technical correction, showing signs of retesting previous breakout zones. On the macroeconomic front, several U.S. economic indicators are adding layers of complexity to this correction phase. The most recent API and EIA crude and natural gas inventory data, set to be released in early June, are likely to influence USD strength through energy-linked inflation expectations. Furthermore, multiple upcoming speeches by key Federal Reserve FOMC members, including Barkin, Goolsbee, and Kugler, may provide forward guidance on monetary policy. These events come amidst a backdrop of mixed GDP and labor market signals, including stable but lagging jobless claims and a moderately optimistic housing sector. All of this suggests that while the USD has moments of strength, BTC remains in a longer-term bullish structure, but with temporary volatility.

D1_Daily_BTCUSD_Chart_Analysis_Price_Action_Outlook_05_29_2025.jpg

BTC/USD Technical Analysis
On the daily timeframe, BTC-USD is currently testing the 0.382 Fibonacci expansion level around $108,822 after pulling back from its recent all-time high near $124,050. This area also coincides with a key psychological and structural resistance turned support, making it a critical level to hold for bulls. Price action shows a classic retest pattern, suggesting that the market may attempt to establish a new support base before continuation. However, momentum indicators such as the Stochastic Oscillator show bearish divergence – prices made a higher high, but the oscillator did not – hinting at possible short-term weakness. The Fisher Transform has also started to curve downward, reinforcing the idea of a potential consolidation or deeper retracement. Meanwhile, the Parabolic SAR dots have flipped above price, signaling a bearish bias, and the Alligator indicator lines are beginning to converge, which typically precedes periods of lower volatility or a reversal.


Final Words about BTC vs USD
BTC-USD remains in a broad uptrend despite the recent pullback, and its ability to hold above the 0.382 Fibonacci level will be crucial for maintaining bullish momentum. While fundamentals surrounding the U.S. economy may provide temporary boosts to the USD, Bitcoin’s macro narrative of digital scarcity and institutional interest continues to support the long-term uptrend. Traders should monitor key support levels, divergences in oscillators, and any changes in the tone of upcoming Fed speeches for directional cues. Risk management remains essential, especially with heightened volatility expected ahead of economic data releases and central bank commentaries. In conclusion, while short-term corrections are healthy, Bitcoin remains well-positioned for further gains if the technical structure holds.


05.29.2025
 

Create an account or login to comment

You must be a member in order to leave a comment

Create account

Create an account on our community. It's easy!

Log in

Already have an account? Log in here.

Similar threads

Users Who Are Viewing This Thread (Total: 3, Members: 0, Guests: 3)

Top
AdBlock Detected

We get it, advertisements are annoying!

Sure, ad-blocking software does a great job at blocking ads, but it also blocks useful features of our website. For the best site experience please disable your AdBlocker.

I've Disabled AdBlock    No Thanks