What's new

Daily Market Analysis and Overview by Unitedpips

5.00 star(s) 2 Votes
BTC/USD Facing Critical Support Amid Economic Uncertainty


Introduction to BTCUSD
The BTC/USD pair, commonly known as "digital gold," represents the exchange rate between Bitcoin, the leading cryptocurrency, and the US dollar, the global reserve currency. This widely watched pair is crucial for traders and investors seeking to leverage volatility and capitalize on market movements. Monitoring BTCUSD helps gauge cryptocurrency sentiment and understand broader market dynamics.


BTC/USD Market Overview
BTC-USD is currently exhibiting signs of weakening bullish momentum amid recent economic data releases from the United States. Traders remain cautious due to the mixed data surrounding the US balance of payments and upcoming speeches from key Federal Reserve officials, including Jerome Powell. Markets are particularly attentive to hints of future monetary policy decisions, especially given the hawkish rhetoric often associated with Fed Chair Powell’s statements. Additionally, the manufacturing and services Purchasing Managers' Index (PMI) reports indicate moderate economic activity, potentially bolstering the US dollar’s strength. Over the next few days, BTC/USD may experience further volatility influenced by these macroeconomic factors, prompting traders to closely monitor related news events.


BTC/USD Technical Analysis
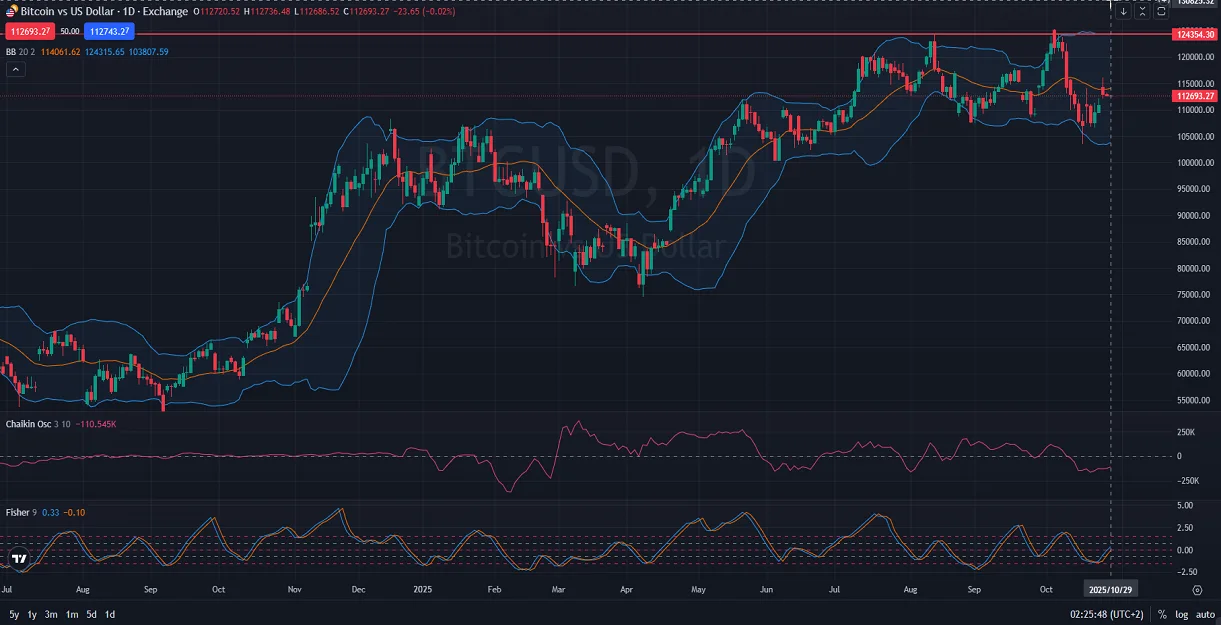
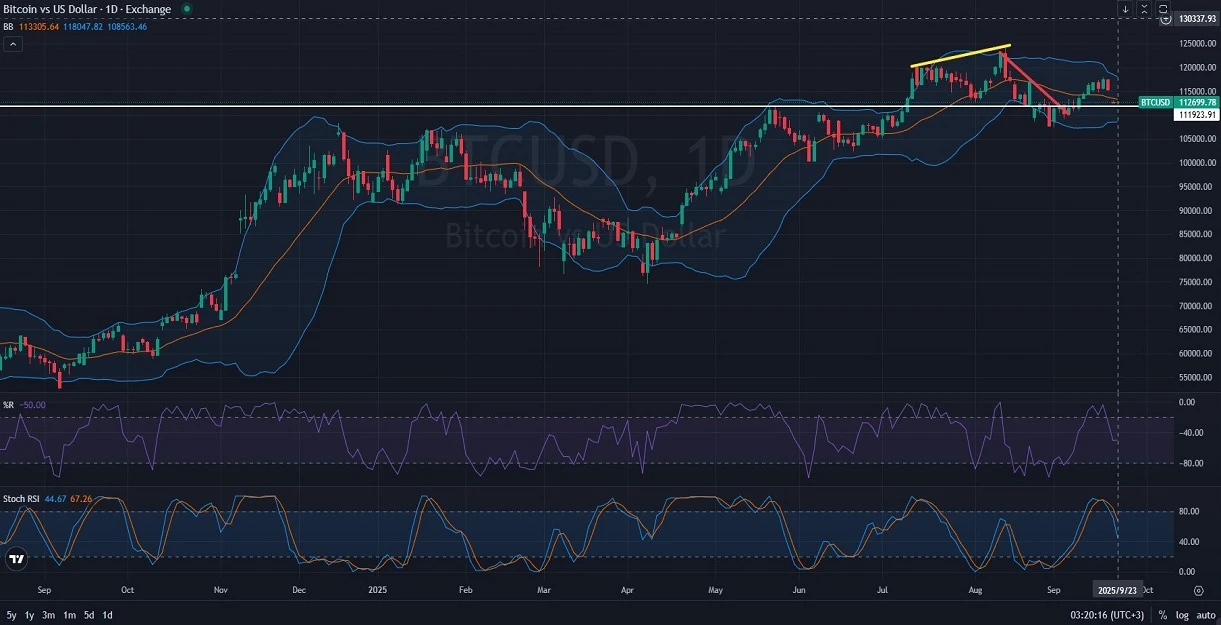
Analyzing the daily BTC-USD chart, the recent price action suggests potential bearish signals. The pair established a new higher high around the $124,500 level but subsequently formed a lower low, failing to surpass previous highs—a clear indication of weakening bullish momentum. This is further confirmed by the recent bearish divergence (RD-) appearing at higher peaks. Currently, BTC/USD is trading near critical support around $112,600, which could provide temporary stability. Bollinger Bands narrowing suggests reduced volatility and potential sideways movement, while the %R indicator at -50 reflects neutral market sentiment. Additionally, the Stoch RSI indicator sits at 44.7 and 67.2, indicating neither overbought nor oversold conditions, thus further reinforcing expectations of consolidation.


Final words about BTC vs USD
Considering the current technical setup and global economic signals, BTC/USD appears poised for potential consolidation or further weakening in the short term. Traders should closely watch the price reaction at critical support levels, particularly around $112,600, and remain attentive to updates from Federal Reserve officials regarding monetary policy, as these could significantly impact the dollar's strength and BTC valuation. Managing risk effectively is paramount due to the inherent volatility of cryptocurrency markets, and traders should remain flexible and responsive to emerging signals and market developments.


Disclaimer: This BTCUSD analysis, provided by Unitedpips, is for informational purposes only and does not constitute trading advice. Always conduct your own Forex analysis before making any trading decisions.


09.23.2025
 
Gold at All-Time High with Bullish Momentum


Introduction to XAUUSD

The XAU/USD pair, often referred to as "gold" represents the exchange rate between gold, the world’s most enduring safe-haven asset, and the US dollar, the global reserve currency. This key trading pair is closely followed by investors and traders who seek stability during times of economic uncertainty or want to capitalize on fluctuations in precious metal prices. Monitoring XAUUSD provides insights into risk sentiment, inflation expectations, and global macroeconomic trends.


Gold Market Overview
XAU/USD has surged to a new all-time high, supported by expectations of Federal Reserve rate cuts, safe-haven demand amid ongoing geopolitical tensions, and steady central bank buying, while a softer U.S. dollar has added to gold’s strength. However, the rally faces potential headwinds as upcoming U.S. economic data — including PCE inflation, PMI reports, and new home sales — alongside speeches from key officials such as Fed Chair Jerome Powell and President Trump, could revive dollar demand and temper momentum. In the near term, traders should brace for heightened volatility, with gold’s trajectory hinging on whether U.S. data and policy signals reinforce the dovish outlook or trigger a corrective pullback.

Gold-Unitedpips-9-24.jpg

Gold/USD Technical Analysis
On the daily chart, XAU/USD has recently broken above a key resistance zone around the $3,700 level, now acting as potential support. The ZigZag (5,10) pattern shows a clear series of higher highs and higher lows, confirming a strong bullish trend that gained momentum in early September. After consolidating within a tight range below $3,700, price surged past this level, indicating a potential continuation of the upward movement. Current price action hovers near $3,763. With the Volatility Close-to-Close rising to 14.28%, market activity has picked up, suggesting increased interest and potential for larger price swings. A sustained hold above $3,700 could open the door toward $3,800 and beyond. However, failure to hold this breakout zone may result in a retest of lower support around $3,660. Overall, momentum remains in favor of the bulls, but traders should be cautious of potential pullbacks in such high-volatility conditions.


Final words about Gold vs Dollar
In summary, the XAU/USD pair continues to reflect a bullish outlook driven by macroeconomic dynamics, technical strength, and heightened market volatility. Gold’s recent breakout above the $3,700 mark underscores strong investor confidence, supported by dovish Fed expectations and geopolitical uncertainty. While the broader trend remains upward, the potential for short-term corrections cannot be ignored, especially with key U.S. economic indicators and policy commentary on the horizon. Traders should remain vigilant, balancing the prevailing bullish momentum with the possibility of sharp price swings as the market digests incoming data. Ultimately, gold’s direction will be shaped by how convincingly it can maintain support above $3,700 amid evolving global and monetary developments.


Disclaimer: This XAUUSD analysis, provided by Unitedpips, is for informational purposes only and does not constitute trading advice. Always conduct your own Forex analysis before making any trading decisions.


09.24.2025
 
USD/CHF Daily Analysis: Trend, Support, and Targets


Introduction to USD/CHF
The US Dollar vs Swiss Franc pair (USD/CHF) measures the exchange rate between the United States dollar and the Swiss franc — a key safe-haven currency. Often watched by macro traders, USD/CHF is sensitive to interest-rate differentials, central bank guidance, and global risk sentiment. Because the Swiss franc is considered a defensive currency, USD/CHF moves frequently reflect shifts in risk appetite and updates from the Federal Reserve and Swiss National Bank. This makes USD/CHF essential for forex traders tracking monetary policy, safe-haven flows, and cross-market correlations.


USDCHF Market Overview
On the Daily (D1) chart USD CHF remains dominated by a broad bearish trend that has accelerated since the pair rolled over from its earlier range high. In the past 48 hours price action shows continued downside momentum with sellers probing near-term support and the pair trading below the moving-average channel — a clear technical sign of bearish control. The macro calendar is crowded with Fed speakers (including Austan Goolsbee, John Williams and other FOMC members) whose more hawkish-leaning comments tend to support the US Dollar; any unexpectedly hawkish tone would likely lift USD relative to the Swiss franc. Conversely, the Swiss National Bank’s policy statements and rate guidance remain the key medium-term driver for CHF strength; SNB communications are scheduled quarterly and will be watched for any hawkish surprises that could tighten CHF support. Expect elevated volatility around Fed commentary and US data releases (GDP, initial jobless claims, durable goods) over the next 24–72 hours — traders should monitor the economic calendar and speaker schedule for USD/CHF trading signals.


USD-CHF Technical Analysis
Price action remains bearish on the daily chart, with candles repeatedly consolidating sideways after each down leg and trading below the moving-average channel (acting as resistance). Key downside targets are the Fibonacci cluster around the 0.618 level (~0.7794) and the 0.786 level (~0.7694). Momentum tools show a short-term easing (Accelerator Oscillator green ~0.00236) but no confirmed reversal, while the Chaikin Oscillator (~27.669K) signals muted accumulation — overall favoring sell-the-rallies. A decisive close above the descending trendline and the 0.810–0.815 zone would be required to flip the bias; otherwise the path of least resistance stays down toward the 0.618 area.


Final words about USD vs CHF
USD/CHF remains a macro-sensitive currency pair where central bank communication and risk sentiment dominate price action. With the pair below the moving-average channel and pressured by a descending trendline, the technical bias is bearish and traders should prioritize short setups, measured moves, and Fibonacci targets (notably the 0.618 retracement). Keep a close eye on upcoming Fed speeches and US economic releases — any hawkish surprises could temporarily support the US Dollar and trigger corrective bounces in USD/CHF. Conversely, hawkish SNB commentary or unexpected CHF buying interest would accelerate declines. Risk management is critical: use clear stop levels above the moving averages/resistance and scale position sizes if trading around high-impact events. For daily USD/CHF analysis and forex trading signals, combine economic calendar events with technical confirmations (trendline breaks, MA crossovers, and oscillator divergences) before acting.


Disclaimer: This USDCHF analysis, provided by Unitedpips, is for informational purposes only and does not constitute trading advice. Always conduct your own Forex analysis before making any trading decisions.


09.25.2025
 
Daily EUR/GBP Outlook: Ascending Channel Guides Pair Higher


Introduction to EURGBP
EUR/GBP, commonly referred to as the "Chunnel," represents the exchange rate between the Euro and the British Pound Sterling. This pair is particularly significant as it reflects economic conditions across the Eurozone and the UK, heavily influenced by monetary policy decisions from both the European Central Bank (ECB) and the Bank of England (BOE). Traders frequently use EUR/GBP as a benchmark for European economic sentiment and stability.


EUR-GBP Market Overview
Currently, EUR GBP is exhibiting bullish momentum, driven by recent economic news and market sentiment. GBP recently reacted to economic releases from the Bank of England, including the Money Supply, Mortgage Approvals, and Consumer Credit data. Stronger-than-forecasted data in these reports usually bolster GBP strength by indicating a healthy economic outlook and potentially higher interest rates. Meanwhile, the Euro's strength hinges on the upcoming CPI report and insights from Deutsche Bundesbank President Joachim Nagel, expected to influence future ECB policy direction. Market sentiment remains cautiously optimistic about the Euro, as inflationary pressures in the Eurozone suggest potential tightening from the ECB, boosting EUR's attractiveness.


EUR/GBP Technical Analysis
Technical indicators on the daily chart suggest EURGBP is trending upwards within a well-defined ascending channel. Currently, the pair struggles near the midpoint of this channel, moving sideways within a rectangle-shaped consolidation zone. Price action indicates potential retracement to the bottom boundary of the rectangle, yet a continuation of the bullish trend toward the upper channel line is more likely. The Parabolic SAR indicator remains below current price levels, highlighting bullish sentiment. Additionally, the MACD indicator confirms bullish momentum, displaying bullish crossover and positive histogram bars, supporting further upward movement.


Final Words about EUR vs GBP
Overall, the EUR GBP pair appears positioned for sustained bullish momentum in the short term, supported by technical patterns and positive Eurozone inflation expectations. Traders should remain vigilant for potential market-moving comments from ECB and BOE officials and carefully monitor upcoming inflation and economic data releases. Key support and resistance levels within the ascending channel provide critical reference points for managing trade entries and exits. It is crucial to adopt a cautious yet opportunistic approach, given the sensitivity of this pair to shifts in monetary policy outlook.


Disclaimer: This EURGBP analysis, provided by Unitedpips, is for informational purposes only and does not constitute trading advice. Always conduct your own Forex analysis before making any trading decisions.


09.29.2025
 

Create an account or login to comment

You must be a member in order to leave a comment

Create account

Create an account on our community. It's easy!

Log in

Already have an account? Log in here.

Similar threads

Users Who Are Viewing This Thread (Total: 1, Members: 0, Guests: 1)

Top