What's new

RoboForex - Forex Broker: overview and news

4.60 star(s) 7 Votes
How to Trade the Kicker Candlestick Pattern

Author : Victor Gryazin


Dear Clients and Partners,

In this review, we will get acquainted with a rather rare reversal candlestick pattern called Kicker. We will consider the features of its formation and the rules of trading with it.

How a Kicker candlestick pattern is formed

The Kicker candlestick pattern is not often seen on price charts and portends a reversal of the current trend, showing a sudden change in market sentiment. It is usually caused by important or unexpected news related to an asset.

A pattern consists of two candles of different colours: if the first is white, the second is black, and vice versa. The size of the body of the candles does not particularly matter. The body of the first candle follows the direction of the current trend, and the second candle opens with a gap from the opening price of the first candle and closes in the opposite direction.

The peculiarity of this pattern is that the second candle opens immediately with a large gap against the direction of the trend. If the first candle of the pattern is "bearish", the gap widens, and a white candle appears; if the first candle is "bullish", the gap shrinks, and a black candle follows. The gap covers the whole body of the first candle and forms a gap with its opening price.

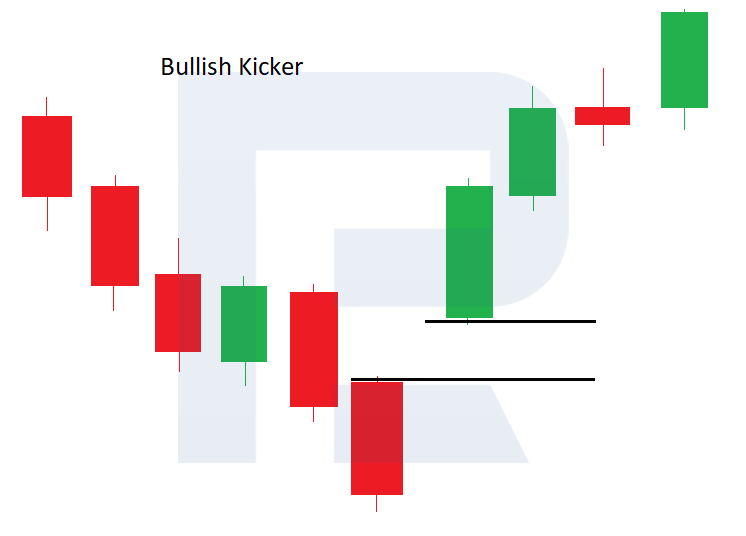
A bullish Kicker candlestick pattern

This forms on the price chart during a downtrend when there is an active downward price movement and local lows are formed. First, the first black candle of the pattern appears, then the second candle opens with a large gap upwards and closes in white, showing growth. The "bears" were moving the market down, confident in their strength, but unexpected positive news strongly influenced market participants, and the situation changed dramatically. Now, the "bulls" have taken the initiative.

Thus, a bullish candlestick pattern Kicker has been formed on the chart. It is fully formed after the closing of the second candle with a white body, and it is assumed that the bulls, having received unexpected support and going on the offensive, will continue to move the price upwards. Thus, we can expect a severe upward correction or even a reversal and the start of a bullish trend.


Bearish candlestick pattern Kicker

This forms on the price chart during an uptrend, which is when there is a strong upward price movement and local highs are formed. First, the first white candle of the pattern appears, then the second candle opens with a large downward gap and closes in black, showing a decline. "The bulls" had been driving the market upwards with a strong initiative, but unexpected negative news strongly influenced the market participants, and the situation changed dramatically: now the bears have taken the initiative.

So, a bearish Kicker candlestick pattern has been formed on the chart. It is fully formed after the second candle closes with a black body, and it is expected that the "bears", having received unexpected support and going on the offensive, will continue to move the quotes downwards. Thus, we can expect a severe downtrend or even a reversal and the start of a bearish trend.

How to buy on a bullish Kicker pattern
  • During a downtrend, a bullish Kicker pattern forms on the price chart.
  • It is recommended to open a buy position at the opening of the next candle after forming the pattern. Stop Loss can be set at the low of the first black candle.
  • The Fibonacci retracement lines and significant resistance levels can be used to set Take Profit.
Read more at R Blog - RoboForex

Sincerely,
RoboForex team
 
How Should a Beginner Prepare a Trading Plan?

Author : Victor Gryazin


Dear Clients and Partners,

In this overview, we will discuss preparing trading plans. A trading plan helps evaluate the current market situation and make the trader’s plans come to life.

What is a trading plan necessary for?

A trading plan is something like a road map for traders. Based on the trading strategy that you use, a trading plan formulates existing trading opportunities and promising trades. Promising trades are those that have a high probability of a success; they are made in the right place, at the right time, with a moderate risk and a good potential profit.

A trading plan must describe your trading ideas, your analysis of the current situation in detail. It makes a “picture” of your view on the market on paper (or in a file). On the whole, successful analysis and a correct opinion about the market do not guarantee good trading by themselves, however, your current thoughts can show you the field where you can look for trading ideas.

Having a clear and easy-to-understand trading plan, a trader stops making chaotic emotional trades. They are no more a helpless wood chip on market waves. They set their sails and starts off towards their profit, finding and closing promising trades. Thanks to the plan their trading becomes more efficient.

Preparing the plan

The process of preparation can be split in several steps: technical picture, fundamental factors, additional signals (indicators), risk control, taking the profit. Active traders make trading plans every day in the morning, bringing it to life during the day with necessary corrections and amendments.

Step 1: Technical picture

To evaluate the technical picture in an instrument, we use good old tech analysis. Open the chart of your financial instrument, check several timeframes (starting with larger ones and going down to smaller ones), and mark all the important factors:
  • Trend direction, trend lines
  • Support and resistance levels
  • Tech analysis patterns
  • Additional signals: Fibonacci levels, candlestick combinations, Price Action patterns, various original methods.
After you have marked everything on the chart, find suitable entry points on it by your strategy. Choose signals based on which you will open your position: a breakaway of or a bounce off an important level, exiting a price range, a complete tech analysis pattern, etc. Mark all the entry points and confirming signals in your trading plan.


Step 2: Fundamental factors

The main thing that pushes quotations in the market forward is fundamental news, such as decision on interest rates, publications of macroeconomic indicators, speeches of politicians, etc. Such news provokes volatility and gives guidelines for quotations.

To find out which news will come out and when, use an economic calendar. Open it in the morning and mark important events of the day. After some serious data emerges, a signal to open a position by your trading plan might appear – this is the gist of trading news. Or, on the contrary, you will have to close a profitable position or minimize risks (by pulling the Stop Loss closer) before some data appears.

Step 3: Signals from indicators

These days, there are plenty of indicators that help traders carry out holistic market analysis. Trading indicators are mathematical functions based on price or volumes. They not only help to analyze the market but can also give additional trading signals. Some indicators are good for trends, some – for flats, some are universal.

As a rule, traders use indicators as a supplement to tech analysis. Indicators can give confirming signals for opening positions; show the direction of the trend; give indications for placing Stop Losses and Take Profits. Write down the indicators you use and the opening and closing signal they give in the trading plan.

Read more at R Blog - RoboForex

Sincerely,
RoboForex team
 
How to Trade the “Two Moving Averages + Fractals” Strategy

Author : Victor Gryazin


Dear Clients and Partners,

In this overview, we will describe the simple medium-term swing trading strategy “Two Moving Averages + Fractals”. We will explain how it works, how to set the indicators, and how it can be used in trading.

What is swing trading?

Swing trading is a medium-term trading style that implies working with various financial instruments over the course of a few hours to a few weeks. As a rule, swing traders open trades in the direction of the current trend to catch the price movement momentum after the end of a local correction. In their search for trading opportunities, swing traders mainly use technical analysis.

How the “Two Moving Averages + Fractals” strategy works

The strategy uses two moving averages (Moving Average, MA) – the EMA (10) and SMA (30) – to confirm the trading direction and search for trading signals. The MA indicator has long been considered a simple and effective tech analysis tool, which tracks trend movements well. To pinpoint entry and exit points on the price chart, the strategy also uses Bill Williams’ Fractals indicator.

How the strategy works:
  • To find buy signals, the trader needs a downward correction after an upward price impulse. The EMA (10) must be above the SMA (30), confirming the uptrend. During the correction, the price should fall to the SMA (30) and form an uptrend reversal with the formation of a lower fractal – this will be a signal to buy
  • To find sell signals, the trader needs to wait for an upward correction after a downward price impulse. The EMA (10) must be below the SMA (30), confirming the downtrend. During the correction, the quotes must rise to the SMA (30) and form a downward reversal with the formation of an upper fractal – this will be a signal to sell

It should be noted that the Two MAs + Fractals strategy is particularly suitable for trading various financial instruments. The recommended timeframes on the chart are H1, H4, and D1. Trades are made in the direction of the trend at the end of the correction.

How to install the Moving Average and Fractals indicators

To install the indicators on the popular trading platforms MetaTrader 4 and MetaTrader 5, follow the process below:
  1. Open the terminal and log in to your account.
  2. Select the chart of your desired instrument.
  3. From the Main Menu, go to – Insert – Indicators – Trend, and then click on Moving Average.
  4. In the settings window that appears, select the period 10, the colour and width of the line, MA method – Exponential. Click OK to apply the parameters and close the settings window.
  5. Repeat the actions above but in the settings window select the period 30, the colour and width of the line, and the MA method – Simple. Click OK to apply the parameters and close the settings window.
  6. Go to the Main Menu – Insert – Indicators – Bill Williams, choose Fractals
  7. In the setting window that pops up choose the colour and size of the fractals; other parameters are set up automatically. Click OK to apply the parameters and close the setting window.

How to buy with the “Two MAs + Fractals” strategy
  • The market Is in an uptrend, and the EMA (10) is above the SMA (30)
  • During a downward correction, the quotes drop to the SMA (30) and form an upward reversal with the formation of a lower fractal
  • The trader opens a buy position and sets the Stop Loss just below the local low formed by the correction
  • The position is closed when the opposite upper fractal appears on the chart
Read more at R Blog - RoboForex

Sincerely,
RoboForex team
 
RoboForex provides access to CFDs on Futures


Dear Clients and Partners,

We are happy to announce the latest expansion of our product line: in addition to the 12,000 instruments already available at RoboForex, you can now trade CFDs on Futures.

This is an excellent opportunity to trade this asset using higher leverage than on an exchange and benefit from the absence of swaps (rollover fees). CFDs on futures at RoboForex are available on MetaTrader 4/5 and R StocksTrader platforms.

Learn more >​

Trade CFDs on futures at RoboForex on the following account types:


Start trading with RoboForex, and try out this and other trading assets with competitive conditions:
  • 12,000 trading instruments within nine asset classes
  • Floating spreads from zero points, and fast order execution
  • Minimum deposit from 10 USD
  • Leverage up to 1:2000

Sincerely,
RoboForex team
 
How to Trade the “Base 150” Strategy

Author : Victor Gryazin


Dear Clients and Partners,

In this review article, we will talk about the medium-term indicator strategy “Base 150”. We will explain how it works, how to set the indicators, and how the strategy can be used in trading.

How the “Base 150” strategy works

This indicator strategy uses four exponential moving averages (Moving Average, MA) – EMA (6), EMA (25), EMA (150), and EMA (365) – to confirm the trading direction and search for trading signals. This indicator has long been considered a simple and effective tech analysis tool, which helps determine trend movements and support or resistance areas on the price chart.

The name “Base 150” comes from the first version of the strategy, which used only one slow-moving average EMA (150). This trading approach was later improved to include one more moving average EMA (365), but the name remained unchanged. In this strategy, the Moving Averages not only serve as trend indicators but also as dynamic support/resistance levels, which are used to conduct trades.

How the “Base 150” strategy works:
  • To find buy signals for a financial instrument, the quotes should rise above the slow EMA (150) and EMA (365), thereby confirming the uptrend. Next, the trader needs to wait for a downward correction until the price first touches one of the four moving averages, followed by an uptrend reversal – this will be a signal to buy
  • To find sell signals for a financial instrument, the quotes should settle below the slow EMA (150) and EMA (365), thus confirming the downtrend. Then the trader needs to wait for an upward correction until the price first touches one of the four moving averages, followed by a downward reversal – this will be a signal to sell


The “Base 150” strategy is primarily aimed at trading the EUR/USD, GBP/USD, USD/CHF, and USD/JPY currency pairs. However, it is versatile enough and can be used to trade other financial instruments. The recommended timeframes on the chart are H1, H4, and D1. Trades are made in the direction of the trend after the price rebounds from the Moving Averages. Risk management for this strategy implies that possible losses per trade should not exceed 1% of the deposit.

How to set up the Moving Average indicators

To set up the indicators on the popular trading platforms МetaTrader 4 and МetaTrader 5, follow these steps:
  1. Open the terminal and log in to your account.
  2. Select the chart of your desired instrument.
  3. From the Main Menu, go to – Insert – Indicators – Trend, and then click on Moving Average.
  4. In the settings window that appears, select period 6, the colour and width of the line, MA method – Exponential. Click OK to apply the parameters and close the settings window.
  5. Repeat the actions above for the other three moving averages. In the settings window that appears, select the periods 25, 150, and 365, the colour and width of the line, MA method – Exponential. Click OK to apply the parameters and close the settings window.
  6. As a result, the chart will show four Moving Averages – EMA (6), EMA (25), EMA (150), and EMA (365).


How to buy with the “Base 150” strategy
  • The market is in an uptrend, with the quotes and fast-moving averages EMA (6) and EMA (25) rising above the slow-moving averages EMA (150) and EMA (365)
  • The trader waits for a downward correction until the price first touches any of these moving averages, followed by an upward price reversal. Further touches should be ignored as the trade is to be opened only after the very first touch
  • For a more accurate entry when the price touches the moving average, a lower timeframe (e.g. H1 for H4 or H4 for D1) can be used to trace how quotes reverse upwards
  • In case of an upward reversal, a buy position is opened. If there is no reversal, the signal is ignored, and the trader waits for other moving averages to be touched
  • Stop Loss is set just below the local low formed by the correction. The expected Take Profit should be twice the Stop Loss amount
Read more at R Blog - RoboForex

Sincerely,
RoboForex team
 
Thanks for the excellent strategy its much appreciated. What are the colours for the various EMAs , i see the EMA6 is orange
 
False Signals in Forex: How to Detect and Avoid Them?

Author : Maks Artemov


Dear Clients and Partners,

Having opened a position, many traders ponder at the question: “Why did it close with a loss if I seemed to do everything right? Almost all signals by the strategy were there but in the end, the price went in the opposite direction”. The keyword in the question is “almost”. Sometimes the market makes movements that you cannot forecast or calculate, in which case indicators turn out virtually useless. What was the point? What went wrong? The answer is simple: the trading strategy gave a false signal, and the trade turned out losing.

Let us try to make it clear why such things happen and why false signals appear.

Why do false signals emerge?

News is, perhaps, the most frequent reason for false signals. As you know, the market accounts for everything, and before some news is officially published, the quotations react and start moving in a certain direction. Normally, if some preliminary results turn out better than expected (such as the GDP reports), the quotations will grow. However, practice shows that the quotations start growing before the publication of the news itself, and at the renewal of the data, the market makes an abrupt reversal and starts a steep decline.

At this moment, Stop Losses trigger at the positions opened beforehand, and impatient market participants worsen the situation, craving for a swift and large profit. Several minutes after the publication of the news, the market calms down, and the price starts going in the correct direction.


False breakaways of levels

In tech analysis, the most widespread false signals are false breakaways of levels. There are two options of trading support and resistance levels: to trade bounces off them or their breakaways. Here is where market players get mistaken.

Let us imagine trading bounces off the resistance level. The price reached the level, and the trade decided to open a selling trade. They placed the SL behind the level (in a safe zone) but the price broke the level away and close the trade by the SL.

What do impatient traders do in such cases? Normally, they open an opposite (buying) trade and get their position closed by the SL again. The conclusion is simple: impatience and hurry will never do you good in trading.


How to avoid false signals?

As I have said above, you will hardly exterminate false signals altogether. But minimizing their number is available to almost any trader, just follow several rules:

When trading the news, check the history

Using fundamental analysis for trading, study the influence of some news on the market historically. Quite often, the market reacts to the same news in the same way, so you can forecast the reaction and make the right decision.

Do not hurry to open an opposite order

If your first position closed by the SL, do not rush at opening an opposite one. In most cases, the market will carry on in the direction of your initial position. Note that you usually open an opposite order not by the strategy but emotionally.

Read more at R Blog - RoboForex

Sincerely,
RoboForex team
 
How Does Gold Influence on Forex?

Author : Victor Gryazin


Dear Clients and Partners,

Gold is one of the first metals that people learned to mine, process, and use. First gold artifacts belong to the pre-dynastic period in Ancient Egypt, i.e. about 5000 B.C. Thanks to being beautiful, rare, and durable, gold has always been used as a universal exchange means, an analog of money.

In this article, we will discuss how the fluctuations of gold quotations influence the prices on Forex.

Gold standard

The gold standard is a monetary system that emerged as a result of the wide use of gold as a universal currency. The gold standard guarantees that all the issued money can be exchanged for the corresponding amount of gold on demand. In transactions between countries that use the gold standard a fixed exchange rate of the currencies is used, based on the standard.

The gold standard that was in force after WW2 was accepted at a conference in Bretton Woods. According to the international agreement, the USA was committed to providing for the gold standard of 35 USD per troy ounce of gold. Only countries represented by their Central banks got the right to exchange dollars for gold. So, at that time the USD was really supported by gold and acquired the status of the global reserve currency.

The epoch of the gold standard ended in 1971 when the USA abandoned the free exchange of the USD for gold. The main reason for the collapse of the Bretton Woods system is the excessive quantity of dollars issued by the USA that were not supported by gold anymore. Since then, the amount of dollars in the world economy keeps growing, currency rates are set by the market, while gold is growing more expensive every year, renewing all-time highs.

This year, gold set another record, rising above 2,000 USD per troy ounce. And the growth of gold is likely to continue because the USA keeps printing dollars and pouring them into the global economy.


Which currencies are influenced by gold?

The price of gold can influence the rates of almost all currencies. Changes in the demand for and supply of gold affect the USD firsthand because the price of gold is usually given in the USD. Also, the dynamics of gold prices significantly influence those countries that produce the metal at a scale, important for their economies.

The US dollar

As long as the US dollar is currently the main global reserve currency, the price of gold is conventionally given in the USD. Gold and the dollar have inverse correlations: if the dollar falls, gold grows, and if gold falls, the dollar grows. Gold is often considered to be a means of protection from inflation: the former grows alongside the latter. The growth of the world gold reserve might drive the USD down.

The role of gold in crises

During economic and geopolitical crises, gold is likely to grow because trust in currencies decreases. Gold is, in essence, the oldest universal currency, not bound to any national currency. Gold is the most important indicator of global economic and political development.

Beginning crises usually entail a slump in the stock market. As a rule, this pushed gold prices upwards. Investors, getting rid of declining stock assets, buy gold to decrease the risks of their investment portfolio, and get protection from the falling of currency rates.

Read more at R Blog - RoboForex

Sincerely,
RoboForex team
 
Why Would Private Trader Become Manager?

Author : Vadim Kovalenko


Dear Clients and Partners,

Coming to the world of trading and investments, beginners see reaching the desired profitability as their first goal. The only success that is considered truly decent is the situation when a person earns their living by just investments in financial markets.

I would like to remind you that trading is such an occupation that anyone can learn, yet it lacks a career ladder in its classical way. Success expresses itself in the quality of trades and the money you make. Even if you get the maximum from your trading talents, you might still earn less than you need for satisfying your basic needs. Hence, many face the question, what is next.


One way is to start working with investors and attracting money for trust managing. Being a manager, one can increase their working capital several times, and profit will also increase several times in absolute values with the same profitability in relative values. This article is devoted to the correctness of the idea and the underwater rocks on your way to the long-craved financial freedom.

Trading on your own: pros and cons

Let us get started with finding out what means trading on your own, what peculiarities this process has and what conditions it requires. Here we set the rules ourselves, choosing the trading strategy, instruments, and acceptable risks. You only have your own money on the account, so no one will suffer from losses if you fail. Theoretically, your income is limited by nothing but your deposit and psychological peculiarities. This is mostly the main reason to become a financial market player.

Now – to the advantages and drawbacks of retail trading. The pros are:
  • An easy start. To become a trader nowadays, you only need to register an account at a broker and deposit it upon verifying.
  • A low entrance threshold. To start trading, even 10 USD might be enough. In this case, sure, there is little chance for earning your living.
  • Making fast decisions. You do not need to consult or notify anybody of the decisions you make in the market.
  • Profit. As long as you change your instruments and risk levels yourself, you are the one to reap the benefits of your work. Moreover, you also decide when to withdraw or deposit funds.
  • Tax incentives. In certain countries with developing market economies retail investors have the right to pay lower taxes.
And here are the drawbacks of this job:
  • Shortage of funds. A trader can earn up to 5% of their deposit; if the latter is 1,000 USD, you will hardly feel that you make any profit at all. To save a decent sum, you will need at least several years. If you are not employed, you will find yourself in real financial trouble.
  • Time. You will spend several years to learn the theory of trading and drill your skills. Learning in this sphere is continuous.
  • Commission size. As a rule, brokers provide individual conditions to VIP clients only. An ordinary trader has to trade on general conditions that do not always comply with their trading strategy.
  • Psychological load. If your welfare depends solely on your trading, this will be a source of constant stress.
As you see, private trading has both pros and cons. Remember that for making a more stable profit and having a palpable income you need to operate sums starting 100,000 USD. Few traders have such a capital, hence, others decide to attract other people’s money for investments

Asset manager – an important stage of a trader’s development

Overcoming the difficulties of individual trading, a fresh-from-the-oven manager will start looking for money. You can find partners both on the Internet and offline.

Investment account

The majority prefer opening a special account at a broker with public statistics that investors can deposit. In this case, you can avoid personal contact with investors and work just via answering their comments online. To attract partners this way, you need to demonstrate your success and enter the top-10 rating of investment accounts. Money attracted this way are seldom over 5,000 USD.

Read more at R Blog - RoboForex

Sincerely,
RoboForex team
 
What is Volatility and How to Use It on Forex

Author : Victor Gryazin


Dear Clients and Partners,

In this article, we’ll talk about a term called volatility. It’s a very important parameter of the financial instrument price, which is used for forecasts and trading.

What is volatility?

Financial markets never stand still, they are constantly moving. To understand this, just look at the chart of any financial instrument – prices are either rising or falling and quite often trading sideways. For assessing the market activity and price dynamics, there is an indicator called volatility.

Volatility is a range of movements of the financial instrument price over a certain period of time (day, week, month, etc.). In other words, volatility shows how high or low the financial instrument price may rise or fall in a definite time. Volatility can be calculated in percentage or points (the minimum value of price movements)

The stock market is believed to be one of the most volatile and changes in prices of different companies are often measured in percentage. For example, if a stock cost $100 at the beginning of a trading session and added (or lost) $10 during the day, then its volatility equals 10%. Stocks of large companies usually have daily volatility of about 5-10%, mid-caps and low-liquid stocks – 20%, 50%, or even more than 100%.

On the Forex market, price dynamics of currency pairs are less significant in percentage terms but it’s due to the trading volumes, which are also much lower. The volatility of currency pairs is usually measured in pips. For example, USD/JPY is considered to be moderately volatile and usually passes 50-70 pips a day, while GBP/JPY is more volatile and its average daily range is between 100 and 150 pips.


How to use volatility in trading?

First of all, volatility is used for assessing opportunities to trade any given financial instrument. Traders make money on price movements, that‘s why instruments with high volatility are more preferable for trading. The more actively a financial instrument moves, the more opportunities traders have to make a profit on this movement.

Long-term investors are more careful with volatility because they usually trade without Stop orders, while high volatility implies high risks. As a result, they prefer a balanced approach, when they choose an instrument with moderate volatility but which has a powerful fundamental or technical background for long-term movements.

On exchanges, one may directly trade volatility by means of futures and options. For that, a lot of different volatility indices were developed with VIX being one of the most famous. This index is calculated based on the US stock index S&P 500. VIX is sometimes called the “fear index” – at the time of panic it rises and at the time of calmness – vice versa.cur

Indicators for trading using volatility

For calculating and using volatility in trading, a lot of technical indicators were created. Let’s check three of them, which are quite popular with traders.

ATR (Average True Range)

ATR indicator is famous for assessing volatility, which was created in 1978 by J. Welles Wilder). The major goal of ATR is to calculate the current volatility of a financial instrument. Volatility in pips is calculated by averaging out the highest and lowest values of the price over a specified period of time.

The ATR indicator is built in a separate window below the price chart and consists of one major line, which shows only positive values starting from 0. Average True Range shows changes in volatility, it will equally grow when volatility rises in both ascending and descending trends. The higher the market volatility, the bigger the indicator value.

Read more at R Blog - RoboForex

Sincerely,
RoboForex team
 
RoboForex: upcoming changes to the trading schedule in view of the holidays in the US and the UK


Dear Clients and Partners,

We are informing you of the changes to the trading schedule due to the Memorial Day celebration in the US and the Late May Spring Bank Holiday in the UK.

This schedule is for informational purposes only and may be subject to further change.

MetaTrader 4 / MetaTrader 5 platforms

Schedule for trading on CFDs on the US indices (US30Cash, US500Cash, USTECHCash) and the Japanese index JP225Cash
  • 29 May 2023 – trading stops at 7:40 PM server time
  • 30 May 2023 – trading as usual
Schedule for trading on Metals (XAUUSD, XAGUSD) and CFDs on Oil (Brent, WTI)
  • 29 May 2023 – trading stops at 7:40 PM server time
  • 30 May 2023 – trading as usual
Schedule for trading on CFDs on US stocks
  • 29 May 2023 – no trading
  • 30 May 2023 – trading as usual
R StocksTrader platform

Schedule for trading on US Stocks and ETFs
  • 29 May 2023 – no trading
  • 30 May 2023 – trading as usual
Schedule for trading on CFDs on US Stocks and ETFs
  • 29 May 2023 – no trading
  • 30 May 2023 – trading as usual
Schedule for trading on CFDs on the US indices (US30, US500, NAS100) and the Japanese index JPY225
  • 29 May 2023 – trading stops at 7:40 PM server time
  • 30 May 2023 – trading as usual
Schedule for trading on CFDs on the UK100 index
  • 29 May 2023 – no trading
  • 30 May 2023 – no trading
  • 31 May 2023 – trading as usual
Schedule for trading on CFDs on UK Stocks
  • 29 May 2023 – no trading
  • 30 May 2023 – no trading
  • 31 May 2023 – trading as usual
Schedule for trading on Metals (XAUUSD, XAGUSD) and CFDs on Crude Oil (BRENT.oil, WTI.oil)
  • 29 May 2023 – trading stops at 7:40 PM server time
  • 30 May 2023 – trading as usual
cTrader platform

Schedule for trading on Metals (XAUUSD, XAGUSD)
  • 29 May 2023 – trading stops at 7:40 PM server time
  • 30 May 2023 – trading as usual
Please take note of the above trading schedule changes when planning your trading activity.

* This schedule is for informational purposes only and may be subject to further change.

Sincerely,
The RoboForex team
 
How to Trade With the "Cutting Pips" Strategy

Author : Andrey Goilov


Dear Clients and Partners,

Today we will look at the “Cutting Pips” short-term trading strategy which applies such indicators as Bollinger Bands, the Relative Strength Index, and the Average Directional Index. It’s meant to work on the major currency pairs EUR/USD, GBP/USD, AUD/USD, and USD/CAD on the M5 chart.

This article addresses the features of the strategy and how to use three scalping indicators at a time. We will explain the rules for opening positions and the options for setting Stop Loss and Take Profit.

Description of the “Cutting Pips” strategy indicators

Only EMA indicators with different periods should be added to the chart. Traders usually use this tool to determine the trend on the market - if the price is above the EMA line, then the trend is bullish and a buy is anticipated. If the price is under the EMA line, then it is a bearish trend and you are supposed to sell.

The very crossing of the lines of the indicator will also give a signal to open positions, if the EMA with a smaller period crosses the EMA with a larger period downwards - it is a signal for the development of the downward movement. If there is a crossing of EMA with a smaller period and EMA with a larger period from the bottom upwards - it is a signal for an upward movement.

Often, even a test of the EMA line signals an imminent breakaway from it and the continuation of the existing trend. In our case, 38 lines of the EMA indicator will form support and resistance areas on the chart, the test of which the price will be a signal to open a position.

How to open a buy position on an EMA scalping strategy
  • Bollinger Bands (BB) – this indicator forms a band on the price chart, within which the quotes stay for 95% of the time, according to the indicator’s developer. When the price breaks out of this range, it signals that it may reverse and move in the opposite direction. This characteristic of the indicator is also applied in the “Cutting Pips” strategy: the price must test one of the extreme bands to form the first signal for opening a trade

  • Relative Strength Index (RSI) – this is a momentum indicator used to measure the strength or rate of a change in the price movement to analyse overbought or oversold conditions. When the indicator rises above the level of 70, it signals that the asset is overbought and its price might soon be declining. When the RSI value falls below the level of 30, it is a signal that the asset is oversold, and its price might soon be increasing. According to the “Cutting Pips” strategy, the indicator values should be above 70 when selling and below 30 when buying
  • Average Directional Index (ADX) – this helps determine a trend in the market and its strength, but it does not show the direction of the price movement. The indicator ranges from 0 to 100. It is believed that if the ADX value is in the range of 0-25, the market does not have a prevailing trend, while values greater than 25 signal a trend. When trading the “Cutting Pips” strategy, the ADX values should be below 30, which will be the last signal to open a trade
How to set the “Cutting Pips” strategy indicators

To set the indicators on the popular trading platforms МetaTrader 4 and МetaTrader 5, follow these steps:
  1. Open the terminal and log in to your account.
  2. Select the chart of your desired financial instrument.
  3. From the Main Menu, go to – Insert – Indicators – Trend, and then select the Bollinger Bands.
  4. Click OK to close the settings window.
  5. From the Main Menu, go to – Insert – Indicators – Oscillators, and then select the Relative Strength Index.
  6. In the pop-up settings window, select period 7.
  7. Click OK to apply the parameters and close the settings window.
  8. From the Main Menu, go to – Insert – Indicators – Oscillators, and then select the Average Directional Index.
  9. Click OK to close the settings window.
As a result, the chart will show all three indicators – Bollinger Bands, the Relative Strength Index, and the Average Directional Index.

How to buy with the “Cutting Pips” strategy

On the M5 chart, the price is testing the lower band of the Bollinger Bands or falling below it. Given that prices should remain within the range between the indicator’s upper and lower bands for 95% of the time, it can be assumed that the price is likely to exit the range by chance and soon show a reversal

Read more at R Blog - RoboForex

Sincerely,
RoboForex team
 
Why Buffett Keeps Buying Oil and Gas Stocks

Author : Eugene Savitsky


Dear Clients and Partners,

Berkshire Hathaway (NYSE: BRK.B) bought shares of Occidental Petroleum Corporation (NYSE: OXY) again in the first quarter of 2023. Recall that Warren Buffett’s fund has been investing in this company for the fifth consecutive quarter. Following the deal, Occidental Petroleum Corporation is the sixth largest company by investment volume in the fund’s portfolio. In addition, Berkshire Hathaway acquired shares of Chevron Corporation (NYSE: CVX), which is also involved in the oil and gas sector.

Today, we will explain why the Oracle of Omaha is investing in these companies at a time when green energy is gaining popularity and attracting more and more investments, while the oil and gas sector is receiving much less. We will look at the energy sector and analyse how demand for conventional energy sources has declined, given that more environmentally friendly and efficient alternatives exist.

The most popular energy sources

According to BP Statistical Review of World Energy and Our World in Data, global energy consumption increased by 15.3% from 2010 to 2021 inclusive, up from 152.96 to 176.43 TWh (terawatt per hour).

Energy consumption in 2010
  • Oil – 31.3%, 47.89 TWh
  • Coal – 27.4%, 41.99 TWh
  • Gas – 20.65%, 31.58 TWh
  • Firewood – 7.62%, 11.66 TWh
  • Water power – 6.2%, 9.518 TWh
  • Nuclear energy – 4.82%, 7.37 TWh
  • Renewable energy – 1.9%, 2.92 TWh
Trends in global coal demand

Of the energy sources listed above, coal is one of the oldest and least environmentally friendly. In addition, more efficient alternatives have emerged with time. Given this, it can be assumed that demand for coal should have decreased. But according to the International Energy Agency (IEA), global coal consumption is increasing. It was 70,160 PJ (Petajoule) in 1978 and rose to 157,164 PJ by 2020.


Note that coal consumption in China has increased markedly since 2002. At the same time, coal production in the country has risen rapidly, up from 1.04 billion to 3.69 billion tonnes over the last 30 years. In addition, the development of new coal mines continues in the country.

Why is the demand for coal growing?

Hydrocarbons and nuclear energy, which are more environmentally friendly, did not eliminate the use of coal but added to the list of energy sources. This was probably due to the growth of world GDP and the population of the planet. These factors boosted the global demand for energy.

According to World Bank national accounts data and OECD National Accounts data files, from 1960 to 2021 inclusive, global GDP has grown from 10.9 trillion to 86.8 trillion USD.

Investments in the oil industry

If global GDP continues to rise, there will be a need to keep oil production at current levels in the future. This will help avoid a shortage of oil as energy consumption rises.

To maintain production capacity, it is necessary to invest in the development of new fields to avoid depletion of current reserves and keep up with demand. But amid the trend for renewable energy sources, funding for new oil developments has declined over the past few years.

According to OPEC Secretary General Haitham Al Ghais, the oil and gas sector requires investments of 500 billion USD a year, while the incoming amount is much less. Based on the IEA data, the amount invested in the oil and gas sector is at the level of 366 billion USD per year, which is 24% less than the 2018 amount.

Read more at R Blog - RoboForex

Sincerely,
RoboForex team
 
What Is Quantitative Easing and How Does It Influence Currency Rates?

Author : Andrey Goilov


Dear Clients and Partners,

Quantitative Easing is an instrument used by Central banks to add money directly to the country’s economy. QE does not imply printing a lot of physically existing money, rather, this is a process that creates non-cash funds.

As the next step, the Central bank buys bonds in the private sector. This is also called “buying the government debt”. As a result, the profitability of these bonds decreases, while the overall money supply in the economy grows, in contrast.

The logic is simple: when private companies have more money, they can produce more goods and services. The more services and goods there are in the market, the more money consumers will spend on them, pouring the money into the economy. This is How QE helps the economy develop.

Mind that some analysts under QE mean simple asset buying by the Central bank. Remember here that the goal of QE is to increase spending and investments in the economy by creating non-cash funds.

Let us figure out why Central banks use QE at all, how it works, and how an investor can profit from it.

What is QE necessary for?

Clearly, Central banks do not use this measure all the time. QE is a reply to the economic situation in the country that forms under the influence of global trouble; it can also be solving particular problems. For example, it might be aimed at holding inflation and the growth of prices for goods and servicing at a low and, most importantly, stable level.

Another instrument for reaching such a goal is decreasing the key interest rate in the country’s economy. It also supports the development of the economy in times of global crises or recessions.

Low interest rates let private companies and enterprises get cheap loans, inspiring them to spend the loaned money and invest in the development of their business. For physical persons, this works the same way – in, say, mortgages.

However, there is a certain limit to interest rates, so that they cannot be lower than this level. Hence, Central banks use QE when lowering the rate becomes unreasonable and even harmful.

How does QE work?

The rates of state bonds directly influence other interest rates in the country’s economy. If the CB buys a lot of bonds, the interest rates (profitability) of the latter fall, which, in turn, brings down loan rates. We can conclude that QE makes loans cheaper for the private sector, stimulating their spending.

However, this is not all the potential of this measure: QE can also support the economy by the potential growth of prices for various financial assets.

For example, the Central bank buys bonds for 1 million USD from the pension fund, so the fund gets real money instead of bonds. The fund will hardly just keep in on its accounts; instead, it can invest in various financial instruments such as stocks of large companies that can yield much larger profits. Thanks to this, stock markets also grow: when more investors want to buy certain stocks, the price for the latter ones also grows actively.

Next, we have a more direct correlation: when stock prices grow, the capital of their investors also increases; they now have more money to spend, and their spending stimulates economic activity in the country.

Summing up: buying bonds decreases loan rates and supports the stock market. People and companies have more money to spend and thus spend more, supporting the economy.

However, if the private sector just saves the money it has got from the CB, QE will simply not work.

How does QE influence the currency of the country?

At first glance, QE looks like a perfect way to escape an economic crisis threatening the country. However, it entails several potential risks, one being the weakening of the national currency.

An increase in money supply can lead to the devaluation of the national currency against other world currencies – especially those of such countries where the CB does not carry out QE. Things are again logical: money supply increases noticeably, hence, its price in the world market drops. As a rule, the devaluation happens at the start of QE, while closer to the end of the program, the currency can grow significantly.

Read more at R Blog - RoboForex

Sincerely,
RoboForex team
 
RoboForex informs about the end of support for the cTrader platform


Dear Clients,

This is to inform you that RoboForex has decided to cease servicing cTrader accounts. This decision is made following the company's strategy of developing its in-house multi-asset platform, R StocksTrader.

In this regard, we kindly ask you to transfer the funds from your cTrader accounts to the MetaTrader 4/5 or R StocksTrader platforms.

The cTrader platform will be closing down according to the following schedule:
  • 7 June 2023 - termination of registration of new cTrader accounts.
  • 21 June 2023 - switching of trading to the “Close only” mode.
  • 7 August 2023 - closing of the remaining positions, and termination of cTrader accounts deposits.
  • 8 August 2023 - automatic transfer of balances to MetaTrader 4/5 and R StocksTrader accounts.
We hope that the above schedule will enable you to prepare in advance for closing your cTrader accounts and withdrawing your funds in a timely manner.

If you have any questions, please contact the RoboForex Customer Support in any way convenient for you.

Sincerely,
The RoboForex team
 
Bringing Up Positive Attitude towards Trading

Author : Timofey Zuev


Dear Clients and Partners,

In this article, we will discuss developing a positive attitude toward trading. This method is known as a solution-focused approach and is currently the quickest way of acquiring a positive attitude. It was described by a famous psychologist working with traders – Brett Steenbarger.

The advantage of the solution-focused approach is the technique of solving the problems much faster than usual. Also, I want to emphasize the simplicity of the method – you can apply it on your own. It is so appreciated by traders because they know the value of time.

How problems emerge

The method is based on the idea that problems are generated by a person’s mind, and we look at ourselves through them. Let us discuss an example.

A trader who works intraday had several losing days in a row. They failed to follow their money management rules and thus lost all the profit made for several weeks. Before they made the last losing trade, they had slept badly which made them feel even worse and break their trading discipline. They promised themselves that they would sleep well that night but a too large emotional load prevented them from it. In the morning, after a cup of coffee, they made their mind never to repeat their previous mistakes; however, they were afraid of entering the market lest they make a wrong step. They again thought that it was due to their bad sleep and decided to have a good rest. Nonetheless, that evening, their mistakes and missed opportunities kept nagging on them, hence they failed to sleep well again. Then they decided that they suffered from insomnia and started looking for treatment.

However, from the point of the solution-focused approach, the problem was not the trader’s insomnia but their impression that they could not sleep. Such conclusions you make on your own form a negative thinking style, and you start acting based on the label you have put on yourself. As soon as the trader decides that they are a bad expert, or suffer from depression or insomnia, they start interpreting all events and acting from this point of view.

In our example, the trader destroyed their own sleep which immediately deteriorated their work. When they noticed their problem with trading, they blamed insomnia for this; and since then, even if they slept badly once, they will regard it as confirmation of their illness and explain their losses by this fact.

This way a person becomes more and more confident in their problem. A usual course of negative events that earlier was interpreted as normal is now taken as a problem. This leads to emotional distress that further aggravates the situation.

As for traders, such a situation is no surprise for them: they have long known the times of constant profits or losses. Even knowing the statistical probability of such a “coincidence”, they, nonetheless, interpret it as a train of fortunes or misfortunes. Being sure of either option, they change their trading style respectively, changing the size of orders or deciding on excessive risks that they would not afford otherwise. Such violation of their own rules leads to a decrease in the deposit in the end.

The devotees of the solution-focused approach are sure that many human problems do not actually exist but are created by people’s minds. This is just a side effect of the process of looking for the sense of some event. Say, a sequence of random events may be regarded as a chain or intertwined patterns, which makes you think there is a problem while in reality, nothing has changed, and life remains on its usual course. People, traders in particular, are prone to inventing all sorts of problems in the chaos of life.

Why many self-improvement methods never work

In trading, market players use large leverage and admit that they need to be a step ahead of the market to succeed. Also, they know that emotional problems may lead to a violation of the trade discipline and bring significant losses. Naturally, traders get interested in various self-improvement methods and psychological techniques for balancing your mind.

We all know how numerous such techniques and methods are; however, from the point of the approach in question, ordinary methods only aggravate the problem. Let us figure out why it happens.

Back to what we have written above. The trader suffering from insomnia may decide to get rid of it by a doctor’s advice or on their own by some relaxing methods or pills. These methods are good, but it might happen that they will not only solve the problem but only aggravate it.

Using the method in trading

In trading, the method may be used as follows. The trader analyzes the trades made during a certain period: a week (for short-term trading), month, year, etc. Profitable and losing trades are equally scrutinized. For profitable trades, the question is: what exactly did I do right? Remember the steps you figure out (write them down, pin to a wall at your workplace), and feel free to use in trading. The idea is to form a successful working mode based on your own previous experience.

Start every workday by recalling these empirical rules. Make demo-trades or plan your work based on your rules. Practice makes perfect, and soon you will use your rules automatically.

Concentrating on the actions that yield success will improve your results and help to avoid make-belief problems.

The “problem chain” according to the method
  1. Most problems emerge due to a sequence of undesirable events, or just one such event might happen but it will be so major that it attracts the trader’s complete attention.
  2. Such an event or their sequence might be absolutely random but people tend to interpret them as something meaningful and find the reasons for their appearance.
  3. Upon finding the problem, the trader puts all effort into solving it.
  4. Such a course of action only makes a person more sure that the problem does exist; the attempts to solve it only aggravates the problem – this is called a vicious circle.
Read more at R Blog - RoboForex

Sincerely,
RoboForex team
 
RoboForex: upcoming changes to the trading schedule in view of the Juneteenth holiday


Dear Clients and Partners,

We are informing you of the upcoming changes to the trading schedule due to the Juneteenth holiday in the US.

This schedule is for informational purposes only and may be subject to further change.

MetaTrader 4 / MetaTrader 5 platforms

Schedule for trading on CFDs on the US indices (US30Cash, US500Cash, USTECHCash) and the Japanese index JP225Cash
  • 19 June 2023 – trading stops at 7:40 PM server time
  • 20 June 2023 – trading as usual
Schedule for trading on Metals (XAUUSD, XAGUSD) and CFDs on Oil (Brent, WTI)
  • 19 June 2023 – trading stops at 7:40 PM server time
  • 20 June 2023 – trading as usual
Schedule for trading on CFDs on US stocks
  • 19 June 2023 – no trading
  • 20 June 2023 – trading as usual
R StocksTrader platform

Schedule for trading on US Stocks and ETFs
  • 19 June 2023 – no trading
  • 20 June 2023 – trading as usual
Schedule for trading on CFDs on US Stocks and ETFs
  • 19 June 2023 – no trading
  • 20 June 2023 – trading as usual
Schedule for trading on CFDs on the US indices (US30, US500, NAS100) and the Japanese index JPY225
  • 19 June 2023 – trading stops at 7:40 PM server time
  • 20 June 2023 – trading as usual
Schedule for trading on Metals (XAUUSD, XAGUSD) and CFDs on Crude Oil (BRENT.oil, WTI.oil)
  • 19 June 2023 – trading stops at 7:40 PM server time
  • 20 June 2023 – trading as usual
cTrader platform

Schedule for trading on Metals (XAUUSD, XAGUSD)
  • 19 June 2023 – trading stops at 7:40 PM server time
  • 20 June 2023 – trading as usual
Please take note of the above trading schedule changes when planning your trading activity.

* This schedule is for informational purposes only and may be subject to further change.

Sincerely,
The RoboForex team
 
RoboForex Wins Prestigious Award for R MobileTrader Mobile App


Dear Clients and Partners,

We are proud to announce that RoboForex has received a new award from the international expert community, “GFA - B2B 2023”. Our mobile application, R MobileTrader, has been honoured with the "Best Mobile Trading App" title!

R MobileTrader has surpassed competitors' apps in the industry based on the following key criteria:
  • Uninterrupted connectivity between clients and the market
  • User-friendliness
  • Number of trading management tools
We are grateful to the jury and our users who voted for us!

Trade on the award-winning platform – R MobileTrader


Download the application


Sincerely,
The RoboForex team
 
The RoboForex partners promotion with cash prizes worth $1,000,000 has started!


Dear Clients and Partners,

From 1 June 2023, all RoboForex partners can take part in our grand promotion with cash prizes. For ten consecutive months, we will distribute Member Coupons to active partners who have received a commission of more than 500 USD.

600 cash prizes worth $1,000,000


More about the promotion

How to join


More about the RoboForex Partners programme

The higher your commission, the more chances to win!

During each month of the promotion, you can receive up to 31 Member Coupons, each of which increases your chances of winning a prize. The number of Coupons depends on the amount of your partner commission received during the month.


Sincerely,
The RoboForex team
 

Create an account or login to comment

You must be a member in order to leave a comment

Create account

Create an account on our community. It's easy!

Log in

Already have an account? Log in here.

Similar threads

Users Who Are Viewing This Thread (Total: 1, Members: 0, Guests: 1)

Top
AdBlock Detected

We get it, advertisements are annoying!

Sure, ad-blocking software does a great job at blocking ads, but it also blocks useful features of our website. For the best site experience please disable your AdBlocker.

I've Disabled AdBlock    No Thanks