What's new

General About FXOpen – FXOpen.com

4.40 star(s) 7 Votes
10 Best Forex Trading App in 2021


The foreign exchange market is fast-moving, ever-changing and highly competitive. It’s the world’s largest market with a turnover of over $5 trillion per day. A trading platform is a core instrument that lets investors and traders open, manage and close market positions. Nowadays, it’s easier to get access to real-time updates on Forex anytime and anywhere thanks to the increased availability of mobile Forex trading apps. Their major strengths are high efficiency, low-performance requirements, and ease of use.

Read Full on FXOpen Company Blog...
 
Last edited by a moderator:
LTC and EOS – Pullback or the begging of a downtrend?


LTC/USD

The price of Litecoin has been in a decline from today’s open at $159 which was its highest point so far. It made a decrease of 9.67% at its lowest today but is currently being traded slightly high at is sitting at around $149.11.


On the hourly chart, you can see that today’s open the high made after a breakout from the descending triangle in which the price was since the 10th of January. The price fell from its high of $185.8 to the horizontal support level at $122 on three occasions and after the third test, a higher high was made and then finally a breakout to the upside on Tuesday. As the price continued making a higher high it exceeded the $155 horizontal level which was the mid-range of the correctional structure in the descending triangle but failed to go above the midpoint high at $166.7 before making a pullback.

If the prior correction ended with the breakout being the continuation of the uptrend of the higher degree, then the current retracement would be only a local one. In that case from the 27th of January when another retest of the significant horizontal level at the $120 zone was made we have seen the start of the next five-wave impulse with the breakout wave being its 3rd. Now as the price is going to the downside it should find support on the ending point of the assumed 1st wave which is at $146. This was tested today with the price action showing a wick on the hourly chart it appears that support is present at those level.

However if the price continues to move further to the downside it could mean that this increase seen with a breakout to the upside was the continuation of the corrective count.

EOS/USD

From its highest point on Monday at $3.2787, the price of EOS has fallen by 11.75% on the same day and enter a recovery since. It reached $3.15 yesterday which could have been the end of the recovery as it started decreasing again and is currently being traded just above $3.


As you can see from the hourly chart the price made a breakout below its ascending trendline that dates from the 27th of January. This ascending trendline is the 3rd wave from the upward move that starts on the 22nd of January, but it is still unclear whether or not it is an impulse or a corrective count. Judging by the wave personality it looks more corrective at this point which is why I’ve labeled it as an ABC. This is soon going to be validated as if the price continued moving to the downside below the $2.88 zone it could very well mean that we have seen the correctional ABC count.

This forecast represents FXOpen Markets Limited opinion only, it should not be construed as an offer, invitation or recommendation in respect to FXOpen Markets Limited products and services or as financial advice.

Cryptocurrency CFDs are not available to trade in all jurisdictions.
 
Trading hours schedule on February 12th and February 15th


Dear Traders,
Please note that due to the celebration of Lunar New Year's Day in Hong Kong on Friday, February 12th, 2021 and US President's Day on Monday, February 15th, trading hours for some financial instruments will be changed as follows:

Thursday, February 11th, 2021

  • Indices CFD:
    • Hong Kong 50 (#HSI) – trading starts at 03:15 and ends at 06:00.
    All other financial instruments will be traded as usual.

Friday, February 12th, 2021

  • Indices CFD:
    • Hong Kong 50 (#HSI) – trading closed.
    All other financial instruments will be traded as usual.

Monday, February 15th, 2021

  • Spot commodities CFD:
    • Gold (XAUUSD) – trading ends at 20:00;
    • Silver (XAGUSD) – trading ends at 20:00;
    • US Crude (XTIUSD) – trading ends at 19:45;
    • US Natural Gas (XNGUSD) – trading ends at 19:45.
  • Indices CFD:
    • Japan 225 (#J225) – trading starts at 23:00 on Sunday and ends at 18:00 on Monday;
    • US SPX 500 (#SPXm) – 23:00 Sun – 18:00 Mon;
    • US Tech 100 (#NDXm) – 23:00 Sun – 18:00 Mon;
    • Wall Street 30 (#WS30m) – 23:00 Sun – 18:00 Mon.
  • Stock CFD – trading closed.
    All other financial instruments will be traded as usual.

Please consider these changes when planning your trading activities next week.
 
AUD/USD and NZD/USD Signaling More Losses


AUD/USD is slowly moving lower and it is now trading well below 0.7650. NZD/USD is also declining and it seems like it could revisit the 0.7100 support zone.

Important Takeaways for AUD/USD and NZD/USD

  • The Aussie Dollar started a fresh decline below the 0.7700 and 0.7650 support levels against the US Dollar.
  • There is a key bearish trend line forming with resistance near 0.7615 on the hourly chart of AUD/USD.
  • NZD/USD is also moving lower and it is now trading below the 0.7200 support level.
  • There was a break below a major bullish trend line with support near 0.7160 on the hourly chart of NZD/USD.

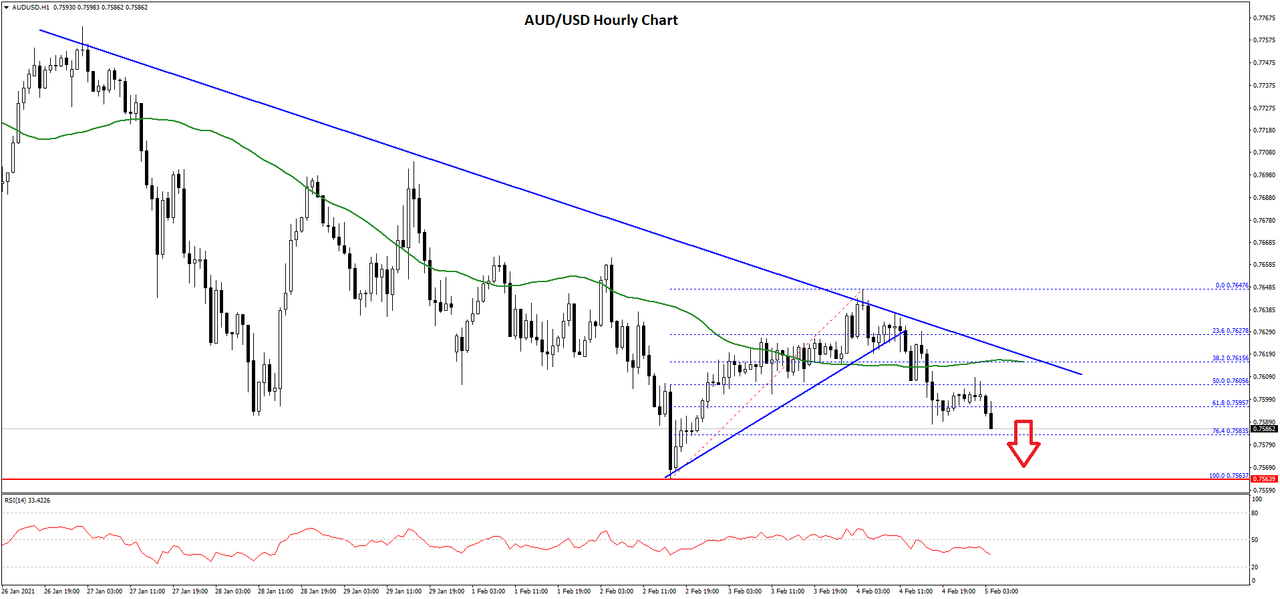
AUD/USD Technical Analysis

After struggling to gain momentum above the 0.7750 level, the Aussie Dollar started a fresh decline against the US Dollar. The AUD/USD pair broke the 0.7700 support level to move into a bearish zone.

The pair even cleared the 0.7650 support level and settled below the 50 hourly simple moving average. A low was formed near 0.7563 on FXOpen before the pair corrected higher. It recovered above the 0.7600 level, but there was no clear break above 0.7650.


As a result, the pair started a fresh decline below the 0.7620 support. The pair even traded below the 50% Fib retracement level of the upward move from the 0.7563 low to 0.7647 high.

There is also a key bearish trend line forming with resistance near 0.7615 on the hourly chart of AUD/USD. It is now testing the 0.7585 support, which is close to the 76.4% Fib retracement level of the upward move from the 0.7563 low to 0.7647 high.

If there is a downside break, the pair could test the 0.7550 support. Any more losses may possibly open the doors for a push towards the 0.7500 level.

On the upside, the 0.7615 level is a major resistance along with the 50 hourly simple moving average. A clear break above the 0.7615 and 0.7620 levels may possibly open the doors for a fresh increase towards 0.7700 in the coming sessions.

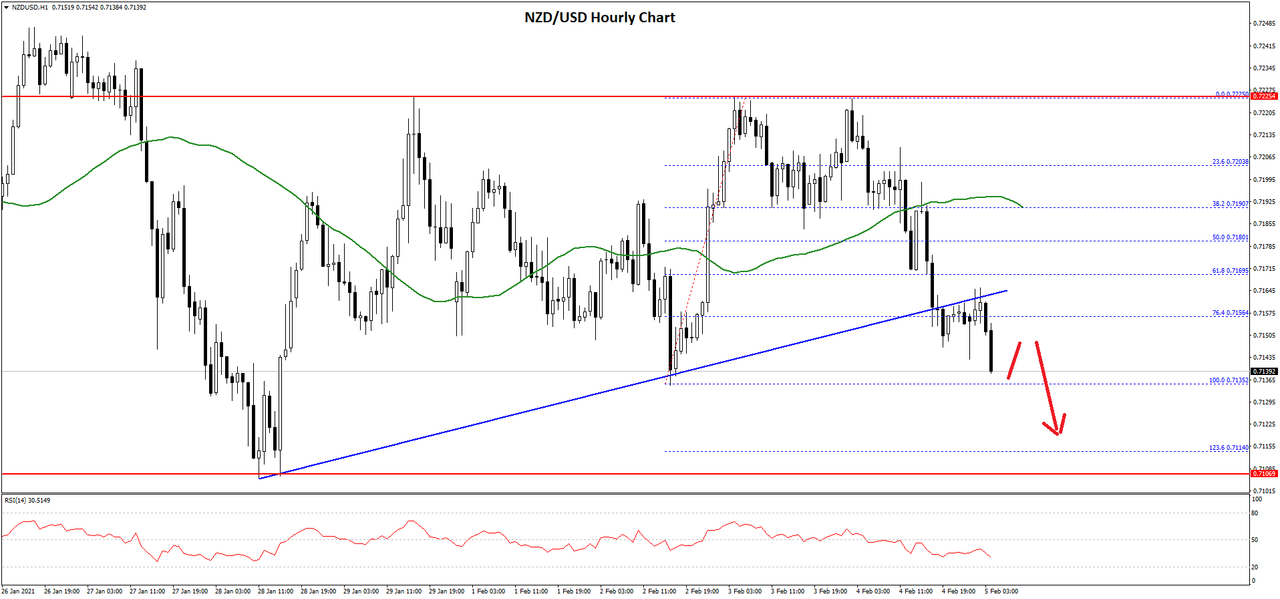
NZD/USD Technical Analysis

The New Zealand Dollar also followed a similar path after it failed to clear the 0.7220 resistance against the US Dollar. The NZD/USD pair broke the 0.7200 support level to start the current decline.

The pair broke the 0.7180 support level and settled well below the 50 hourly simple moving average. There was also a break below a major bullish trend line with support near 0.7160 on the hourly chart of NZD/USD.


The pair is now trading below the 76.4% Fib retracement level of the upward move from the 0.7135 low to 0.7225 high. It is testing the last swing low at 0.7135 and it is likely to continue lower.

The next key support is near the 0.7110 level. It is close to the 1.236 Fib extension level of the upward move from the 0.7135 low to 0.7225 high. Any more losses could push the pair below the 0.7100 support level.

Conversely, the pair could attempt to correct higher above the 0.7155 and 0.7160 resistance levels. The main resistance is near the 0.7200 zone. A clear break and close above the 0.7200 level could increase the chances of more gains above the 0.7220 resistance.
 
GBP/USD and GBP/JPY: British Pound Eyes More Upsides


GBP/USD remained strong above 1.3700, but it is facing hurdles near 1.3750. GBP/JPY is gaining momentum and it is trading well above 144.00.

Important Takeaways for GBP/USD and GBP/JPY


  • The British Pound settled above the 1.3700 resistance zone against the US Dollar.
  • There is a rising channel forming with support near 1.3718 on the hourly chart of GBP/USD.
  • GBP/JPY gained momentum after it broke 143.80 and 144.00.
  • There was a break below a major declining channel with resistance near 143.30 on the hourly chart.

GBP/JPY Technical Analysis


The British Pound started a strong increase from the 142.80 swing low against the Japanese Yen. The GBP/JPY pair traded above the 143.20 and 143.50 resistance levels to move into a positive zone.

There break below a major declining channel with resistance near 143.30 on the hourly chart. The pair settled nicely above the 144.00 level and the 50 hourly simple moving average. The pair even cleared the 144.50 resistance zone and it traded close to the 145.00.

Read Full on FXOpen Company Blog...
 
Weak NFP Report Responsible for USD Bullish Trend Reversal


The U.S. dollar traded with a bullish tone since the start of the trading year. While the move higher is not visible on all markets, the most relevant is the EURUSD as the pair eased from 1.23 to 1.20 in less than a month. Because the Euro has the bigger weight in the dollar index, it led to the dollar rallying against other currencies and even against gold.

However, last Friday the USD reversed course. The February NFP report showed that the U.S. economy added 49k jobs in January. While that was positive, as well as the fact that the unemployment rate dropped to 6.3%, the market sold the USD because the December data was revised lower.


Read Full on FXOpen Company Blog...
 
BTC and XRP – Bullish momentum confirmed


BTC/USD

The price of Bitcoin has broken out from its prior resistance and impulsively came to $48,200 at its highest point today. From its lowest point on Sunda when it was sitting around $37,430, this is an increase of 28%. Currently, a minor retracement is being made with the price sitting at $46,604 but is still in an upward trajectoty.


This breakout indicates that the prior correctional formation from the 10th of January has ended and now we have a clear confirmation with the bullish momentum indicating a strong uptrend continuation. After the five-wave move inside the ascending channel was ended we have seen a minor pullback but an immediate breakout to the upside. This was most likely the 3rd sub-wave of the higher degree 3rd wave which is why further upside movement would now be expected.

As the price is to develop its five-wave pattern further higher highs could be seen in the upcoming days with potentially exceeding the $60,000 mark by the end of its development. However not that an impulsive breakout has seen a local correction might form as the 4th wave should develop before further upside. It is still unclear where the 4th wave could land but most likely we are going to see a retest of the prior all-time high before uptrend continuation.
 
EUR/USD Showing Positive Signs, USD/JPY Turns Red


EUR/USD started a fresh increase after testing the 1.1950 support zone. USD/JPY declined below the 105.00 support and tested the 104.50 zone.

Important Takeaways for EUR/USD and USD/JPY

  • The Euro found support near the 1.1950 region and it started a fresh increase above 1.2050.
  • There is a key bullish trend line forming with support near 1.2100 on the hourly chart of EUR/USD.
  • USD/JPY declined heavily below the 105.20 and 105.00 support levels.
  • There was a break below a major bullish trend line with support at 105.30 on the hourly chart.

EUR/USD Technical Analysis


This past week, the Euro declined below the 1.2050 and 1.2000 support levels against the US Dollar. The EUR/USD pair traded close to the 1.1950 zone, where it found support.

A low was formed near 1.1952 on FXOpen before the pair started a fresh increase. It climbed back above the 1.2000 level and the 50 hourly simple moving average. There was also a break above the 50% Fib retracement level of the downward move from the 1.2155 swing high to 1.1952 low.

It is now trading above the 76.4% Fib retracement level of the downward move from the 1.2155 swing high to 1.1952 low. There is also a key bullish trend line forming with support near 1.2100 on the hourly chart of EUR/USD.

An immediate resistance is near the 1.2120 level. The main resistance is near the 1.2155, above which EUR/USD is likely to accelerate higher towards the 1.2200 resistance area.

Conversely, the pair could start a fresh decline below the 1.2100 support and the trend line. The first major support is near the 1.2075 level and the 50 hourly simple moving average.

If there is a downside break below the 50 hourly simple moving average, the pair could dive towards the 1.2000 handle in the near term. Any more losses might call for a retest of the 1.1950 support level.
 
LTC and EOS – Resistance seen but for how long?


LTC/USD

The price of Litecoin has been increasing in the past week, and from last Thursday when it was sitting at $141.27 at its lowest, we have seen an increase of 37.8$ measured to its highest point yesterday at $194.31. Since then the price made a pullback to $170.54 but is again back in an upward trajectory, currently sitting at $188.


On the hourly chart, we can see that the price broke the prior high made on the 10th of January when the price of Litecoin was sitting at $185.58. This confirmed the impulsiveness behind the move and that the previous correction ended at $118. We have seen the development of the 3rd sub-wave of the higher degree impulse which is why further upside would be expected. However if yesterday’s high was the end of the 3rd wave, now the price might be set for a local correction.

Wave 4 should develop optimally to the 0.382 Fibonacci level which would bring the price of Litecoin to $165. But when the price tested prior resistance for support and confirms the bullish interest it is likely to continue moving past yesterday’s high and end around $230 before the completion of this five-wave move.
 
Gold Price Starts Fresh Decline, Oil Price Correcting Gains


Gold price failed to clear the $1,855 resistance and started a fresh decline. Crude oil price is correcting gains and it might test the $57.00 support zone.

Important Takeaways for Gold and Oil

  • Gold price started a fresh increase, but it failed near $1,855 and $1,860 resistance levels against the US Dollar.
  • There was a break below a major bullish trend line with support near $1,838 on the hourly chart of gold.
  • Crude oil price traded to a new multi-month high near $58.75 before correcting lower.
  • There was a break below a key bullish trend line with support near $58.20 on the hourly chart of XTI/USD.

Gold Price Technical Analysis


Gold price started a decent recovery wave from the $1,785 zone against the US Dollar. The price climbed above the $1,820 and $1,840 resistance levels.

However, the price struggled to clear the $1,855 and $1,860 resistance levels. A high was formed near $1,855 before the price started a fresh decline. There was a break below the $1,840 level and the 50 hourly simple moving average.

The price traded below the 38.2% Fib retracement level of the upward move from the $1,784 swing low to $1,855 high. There was also a break below a major bullish trend line with support near $1,838 on the hourly chart of gold.

The price is now approaching the $1,820 support zone. The 50% Fib retracement level of the upward move from the $1,784 swing low to $1,855 high is also near the $1,820 level.

If there is a downside break below the $1,820 support level, the price might continue to move down towards the $1,800 level. Any more losses could lead the price towards the $1,784 swing low.

On the upside, the price is likely to face resistance near the $1,830 level. The next major resistance is probably forming near the $1,840 level and the 50 hourly simple moving average.
 
Install the FXOpen Traders Tools extension for Google Chrome and use it to help shape your trading strategies

Dear trader,


FXOpen prides itself on providing you with the best Forex trading tools directly from your browser! Install the FXOpen Traders Tools extension for Google Chrome and use it to help shape your trading strategies.

Features

  • Analytics – in-depth technical and fundamental analysis and forecast for currencies and commodities by experienced financial analysts;
  • Quotes – real time prices and spreads;
  • Calendar – important events and releases that affect the forex, stocks and commodities markets;
  • Company news – latest FXOpen company news and promotions;
  • Live news – FX live trading news.

The extension is also connected to the MyFXOpen area and Forex trading accounts page, allowing you to access the information you need with just a single click.

source
 
FXOpen Cashback Program

FXOpen Cashback Program lets traders receive an additional refund for any kind of trades including loss-making. It is easy to get cashback: it is added to your Commission account that is open automatically, with no further actions. The cashback amount is determined in accordance with the total margin used on all client's trading accounts. The program is available for all types of FXOpen trading accounts: ECN, STP, Crypto, Micro, PAMM ECN, PAMM STP.

You can use FXOpen Cashback Program during the first 90 days from the moment of registration for new clients. For existing clients the program is available during 90 days from the moment of joining the program (connection is carried out upon request to the support service at support@fxopen.com). The minimum cashback is $5, the maximum is $1,000. The maximum cashback per trade is $100.


How to calculate Cashback?
The basic partnership commission (a percentage of the FXOpen trading commission or Standard commission) equals 2.4 pips (5-decimal pricing) per trade in an STP or Micro account and 15% of the commission for ECN and Crypto accounts.

Standard Commission is multiplied by a certain coefficient, which depends on the total Used Margin on all client accounts. The table below shows coefficients for cashback calculation. The right column of the table illustrates the cashback calculation of the Standard Commission of $15.

As you can see, the cashback value decreases with the increase in the total Used Margin. Please note, that cashback is not credited, if the total Used Margin exceeds the threshold of $1.05m within 90 days. An example of Cashback calculation and more information on FXOpen Cashback Program you can find in FXOpen Knowledge base.

source
 
GBP/USD and EUR/GBP: British Pound Gains Momentum


GBP/USD is gaining bullish momentum above the 1.3800 and 1.3840 resistance levels. EUR/GBP is declining and it broke a major support at 0.8745.

Important Takeaways for GBP/USD and EUR/GBP

  • The British Pound started a strong increase above the 1.3800 resistance zone.
  • There was a break above a major contracting triangle with resistance near 1.3790 on the hourly chart of GBP/USD.
  • EUR/GBP started a fresh decline after it failed to clear the main 0.8800 resistance zone.
  • There was a break below a key bullish trend line with support near 0.8760 on the hourly chart.

GBP/USD Technical Analysis


After forming a base above the 1.3750 and 1.3780, there was a fresh increase in the British Pound against the US Dollar. The GBP/USD pair broke the 1.3800 and 1.3840 resistance levels to move further into a positive zone.

Moreover, there was a break above a major contracting triangle with resistance near 1.3790 on the hourly chart of GBP/USD. The pair strength and it was able to clear the 1.3850 resistance level.

There was also a break above the 1.3880 level and the pair settled nicely above the 50 hourly simple moving average. A new multi-month high is formed near 1.3901 on FXOpen and the pair is currently consolidating gains.

An initial support on the downside is near the 1.3880 level. The first key support is near the 1.3870 level. It is close to the 23.6% Fib retracement level of the upward move from the 1.3775 low to 1.3901 high.

The next key support is near the 1.3850 level. Any more losses may possibly lead the pair towards the 1.3840 level. It coincides with the 50% Fib retracement level of the upward move from the 1.3775 low to 1.3901 high.

On the upside, the 1.3900 level is a short-term resistance. A close above the 1.3900 level will most likely set the pace for a move towards the 1.4000 level in the near term.
 
Equity Indices Remain Bid as America Awaits New Fiscal Stimulus


Last week brought little or no movements on the financial markets. The VIX index, which measures volatility, dropped to levels not seen so far during the pandemic.

The lack of important economic data contributed to this environment. With a few exceptions, like the CPI or the inflation data in the United States, all other data was second- or third-tier. Effectively, it means that the focus was on the stock market’s price action. This week will likely be the same as it starts with a holiday (i.e., Presidents’ Day in the United States) and no important data until next Friday when the European PMIs are released.

 
Trade Crypto and Stocks CFDs from one ECN account!


Dear Clients,

FXOpen is happy to announce that we have made our trading environment even more efficient and convenient for you! Clients with ECN accounts who trade on MetaTrader 4 and MetaTrader 5 platforms can now trade crypto and stocks CFDs from one ECN account. Available leverage for Stocks CFDs is 1: 5, for Crypto CFDs is 1: 3.


We now offer popular stocks among traders such as Apple Inc., Walt Disney Co., Bank of America Corp., Coca-Cola Co. and others, as well as the most popular cryptocurrencies, including Bitcoin, Ethereum, Litecoin, Ripple. There are more than 100 new instruments available for trading on the MT4 and MT5 platforms. Learn more….

We would also like to inform you that clients who trade on the TickTrader platform now have access to even more trading instruments - over 600 CFDs on the most popular stocks and cryptocurrencies.


FXOpen Company News
 
BTC and XRP – New highs expected


BTC/USD

The price of Bitcoin has continued its upward trajectory from last Monday and came up from $37,691 at its lowest point to $49,808 at its highest point on Sunday which was an increase of 32.15%. From Sunday’s high, we have seen a pullback to the $46,000 zone but the price is now once again in an upward trajectory. Currently, it is sitting just slightly above $49,000 mark and is testing its horizontal resistance.


On the hourly chart, you can see that this rise is the next developing 5th wave from the higher degree impulse and from the lower degree one as well. This is why further upside would be expected but is most likely the ending wave from the rise that started on the 27th of January.

The price has been forming an ascending triangle from the 9th of February when the 3rd impulse wave was formed out of the lower degree. Now as the price has reached the apex of the triangle and then retraced back it appears that it made the completion of the 4th wave corrective structure.

If this is true now another impulse to the upside has started with the price leading towards a new all-time high, potentially above $52,000.

Read Full on FXOpen Company Blog...
 
EUR/USD and EUR/JPY: Euro Holding Key Supports


EUR/USD declined from the 1.2170 zone, but it is holding the 1.2080 support. EUR/JPY climbed higher towards 128.50 and it is currently correcting gains.

Important Takeaways for EUR/USD and EUR/JPY

  • The Euro spiked above the 1.2150 resistance, but it struggled to clear 1.2170.
  • There was a break below a connecting bullish trend line with support near 1.2135 on the hourly chart of EUR/USD.
  • EUR/JPY started a strong increase above the 126.50 and 127.80 resistance levels.
  • There is a major bullish trend line forming with support near 127.70 on the hourly chart.

EUR/USD Technical Analysis

In the past few days, the Euro remained stable above the 1.2050 and 1.2080 support levels against the US Dollar. The EUR/USD pair even made an attempt to gain strength above the 1.2150 resistance level.

The pair spiked above 1.2150 and settled above the 50 hourly simple moving average. However, it failed to continue higher above the 1.2170 level. A high was formed near 1.2169 on FXOpen before the pair started a fresh decline.


There was a break below a connecting bullish trend line with support near 1.2135 on the hourly chart of EUR/USD. The pair even broke the 1.2100 support and the 50 hourly simple moving average.

It found support near the 1.2080 zone and traded as low as 1.2083. It is currently consolidating losses above the 1.2080 support level. An initial resistance is near the 23.6% Fib retracement level of the recent decline from the 1.2169 high to 1.2083 low at 1.2100.

The next major resistance is near the 1.2125 level and the 50 hourly simple moving average. It is close to the 50% Fib retracement level of the recent decline from the 1.2169 high to 1.2083 low. Any more gains could open the doors for a fresh increase above 1.2150.

If EUR/USD fails to recover, it could break the 1.2080 support level. The next major support is near the 1.2050 level, below which the pair could dive towards the 1.2000 support level.

Read Full on FXOpen Company Blog...
 
January 2021 TOP 10 PAMM Accounts Overview


January and New Year’s holidays are over, and the daily routine goes on. Now it is important to achieve stability when investing your savings. February is not a long month by the number of days, and the main challenge is to choose the right investment portfolio so that PAMM managers can show a positive result in such a short period. Read about how FXOpen top PAMM managers performed in January 2021 in our latest review.

Read Full on FXOpen Company Blog...
 
LTC and EOS – Correction soon to come?


LTC/USD

The price of Litecoin continued increasing since last week. From its lowest point last Thursday when it was sitting at $175.78 we have seen an increase of 36.57% measured to its highest point today at $240. Currently, it is being traded just below $230, but the price is in an upward trajectory overall.


Looking at the hourly chart, you can see that the price of Litecoin was in an upward trajectory from the 27th of January when it made the second test of the horizontal support level which was the lower level of the descending triangle in which it was correcting. As a breakout was made in early February it set the price for a higher high than in January. This is the development of the next five-wave move to the upside.

There is still more room to go before the end of this five-wave impulse but it is still unclear where the price increase could end. If the 3rd wave ended on the $194.31 level then currently we are seeing the development of the final wave’s 3rd sub-wave. In that case, another leg up would be expected of the lower degree. But if the 3rd wave of the higher degree count ended on yesterday’s high, then the price of Litecoin has more increasing potential.


Read Full on FXOpen Company Blog...
 
Gold Price Extends Decline, Oil Price Trimming Gains


Gold price struggled to clear $1,850 and started a fresh decline below $1,800. Crude oil price traded to a new multi-month high at $62.21 before starting a downside correction.

Important Takeaways for Gold and Oil


  • Gold price failed to gain momentum and declined below $1,800 against the US Dollar.
  • There is a key bearish trend line forming with resistance near $1,795 on the hourly chart of gold.
  • Crude oil price traded to a new multi-month high near $62.21 before correcting lower.
  • There was a break below a major bullish trend line with support near $61.20 on the hourly chart of XTI/USD.

Gold Price Technical Analysis


Gold price failed to clear the $1,850 and $1,855 resistance levels against the US Dollar. As a result, there was a fresh decline below the $1,825 and $1,820 support levels.

The price gained bearish momentum below the $1,800 support and it even settled well below the 50 hourly simple moving average. It traded as low as $1,760 on FXOpen and it is currently consolidating losses.

An initial resistance on the upside is near the $1,775 level. It is close to the 23.6% Fib retracement level of the recent decline from the $1,826 swing high to $1,760 low.

The first major resistance is near the $1,780 level or the 50 hourly simple moving average. The next major resistance is near the $1,795 level. There is also a key bearish trend line forming with resistance near $1,795 on the hourly chart of gold.

The trend line resistance is close to the 50% Fib retracement level of the recent decline from the $1,826 swing high to $1,760 low. Therefore, the price might struggle to clear the $1,795 and $1,800 resistance levels in the near term.

On the downside, the first major support is near the $1,760 level. The next major support is near the $1,750 level. Any more losses might call for a move towards the $1,720 support level.


Read Full on FXOpen Company Blog...
 

Create an account or login to comment

You must be a member in order to leave a comment

Create account

Create an account on our community. It's easy!

Log in

Already have an account? Log in here.

Similar threads

Users Who Are Viewing This Thread (Total: 1, Members: 0, Guests: 1)

Top
AdBlock Detected

We get it, advertisements are annoying!

Sure, ad-blocking software does a great job at blocking ads, but it also blocks useful features of our website. For the best site experience please disable your AdBlocker.

I've Disabled AdBlock    No Thanks