FXOpen Trader
Active Member
GBP/USD Regains Strength While EUR/GBP Faces Many Hurdles
GBP/USD started a fresh increase above the 1.2000 resistance zone. EUR/GBP is struggling and facing resistance near the 0.8780 level.
Important Takeaways for GBP/USD and EUR/GBP
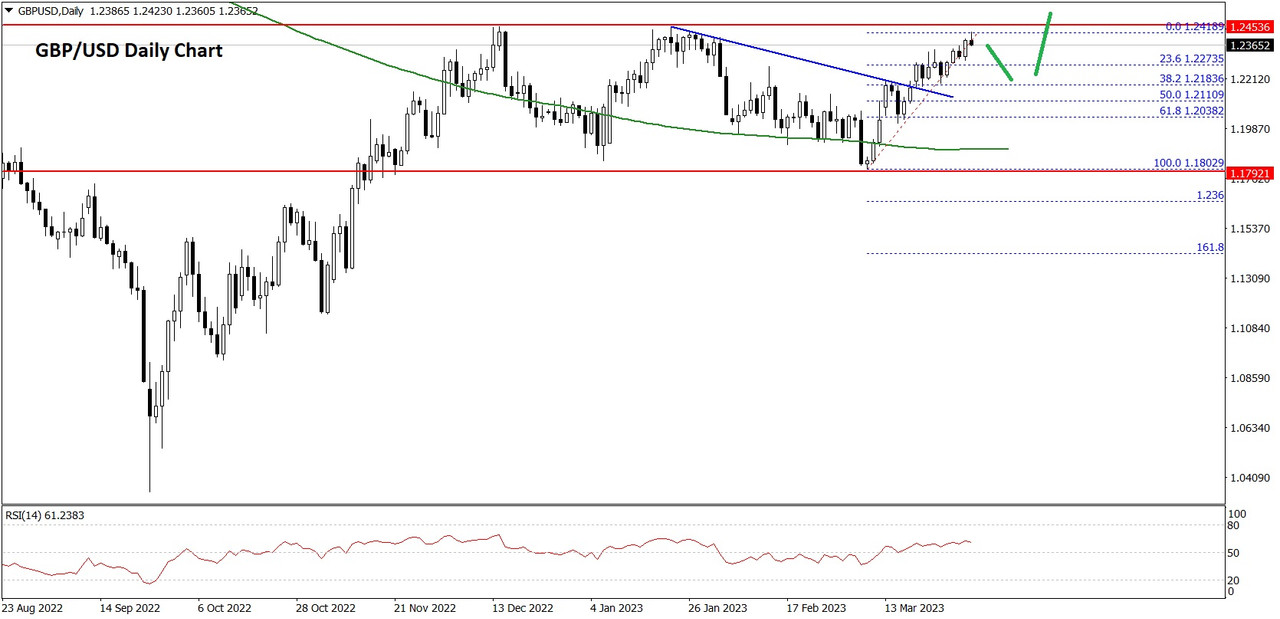
GBP/USD Technical Analysis
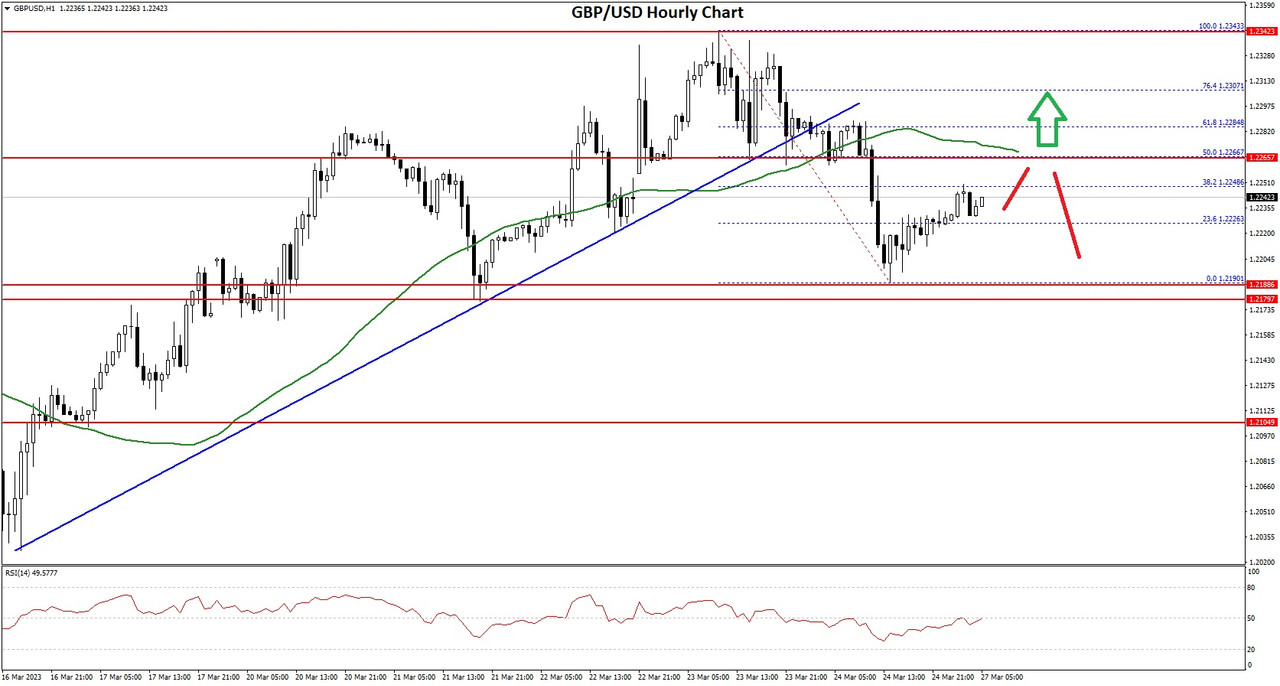
The British Pound steady increase after it settled above the 1.2000 resistance zone against the US Dollar. The GBP/USD pair gained pace for a move above the 1.2080 resistance zone.
During the increase, there was a break above a key bearish trend line with resistance near 1.2120 on the hourly chart of GBP/USD. The pair even broke the 1.2150 resistance zone and settled above the 50 hourly simple moving average.
GBP/USD Hourly Chart
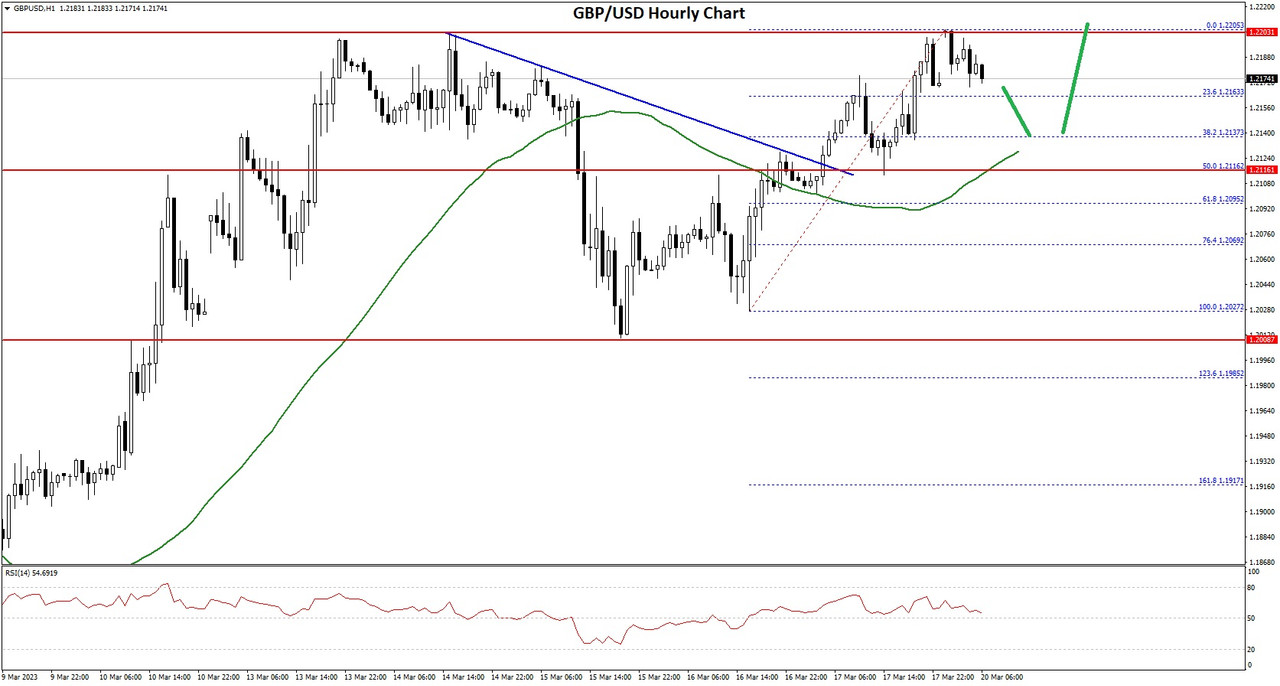
A high is formed near 1.2205 and the pair is now consolidating gains. On the downside, an initial support is near the 1.2160 level. It is near the 23.6% Fib retracement level of the upward move from the 1.2027 swing low to 1.2205 high.
The next major support is near the 1.2120 level and the 50 hourly simple moving average. It is near the 50% Fib retracement level of the upward move from the 1.2027 swing low to 1.2205 high.
Any more losses could lead the pair towards the 1.2050 support zone. On the upside, an initial resistance is near the 1.2200 level. The first major resistance is near the 1.2220 level. A clear move above the 1.2220 level could spark a decent increase.
The next major resistance sits near the 1.2320 level. Any more gains might send the pair towards the 1.2400 resistance zone.
VIEW FULL ANALYSIS VISIT - FXOpen Blog...
Disclaimer: This Forecast represents FXOpen Companies opinion only, it should not be construed as an offer, invitation or recommendation in respect to FXOpen Companies products and services or as Financial Advice.
GBP/USD started a fresh increase above the 1.2000 resistance zone. EUR/GBP is struggling and facing resistance near the 0.8780 level.
Important Takeaways for GBP/USD and EUR/GBP
- The British Pound started a fresh increase above the 1.2000 barrier against the US Dollar.
- There was a break above a key bearish trend line with resistance near 1.2120 on the hourly chart of GBP/USD.
- EUR/GBP found support near 0.8715 and is currently recovering higher.
- There is a major bearish trend line forming with resistance near 0.8780 on the hourly chart.
GBP/USD Technical Analysis
The British Pound steady increase after it settled above the 1.2000 resistance zone against the US Dollar. The GBP/USD pair gained pace for a move above the 1.2080 resistance zone.
During the increase, there was a break above a key bearish trend line with resistance near 1.2120 on the hourly chart of GBP/USD. The pair even broke the 1.2150 resistance zone and settled above the 50 hourly simple moving average.
GBP/USD Hourly Chart
A high is formed near 1.2205 and the pair is now consolidating gains. On the downside, an initial support is near the 1.2160 level. It is near the 23.6% Fib retracement level of the upward move from the 1.2027 swing low to 1.2205 high.
The next major support is near the 1.2120 level and the 50 hourly simple moving average. It is near the 50% Fib retracement level of the upward move from the 1.2027 swing low to 1.2205 high.
Any more losses could lead the pair towards the 1.2050 support zone. On the upside, an initial resistance is near the 1.2200 level. The first major resistance is near the 1.2220 level. A clear move above the 1.2220 level could spark a decent increase.
The next major resistance sits near the 1.2320 level. Any more gains might send the pair towards the 1.2400 resistance zone.
VIEW FULL ANALYSIS VISIT - FXOpen Blog...
Disclaimer: This Forecast represents FXOpen Companies opinion only, it should not be construed as an offer, invitation or recommendation in respect to FXOpen Companies products and services or as Financial Advice.